How Did Goodyear Tire & Rubber Perform in 2Q16?
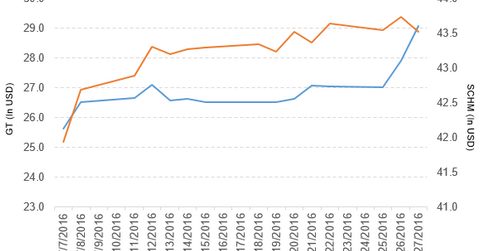
Goodyear Tire & Rubber Company (GT) has a market cap of $7.8 billion. It rose by 4.2% to close at $29.09 per share on July 27, 2016.
July 29 2016, Published 1:17 p.m. ET

Price movement
Goodyear Tire & Rubber Company (GT) has a market cap of $7.8 billion. It rose by 4.2% to close at $29.09 per share on July 27, 2016. The stock’s weekly, monthly, and year-to-date (or YTD) price movements were 9.2%, 18.6%, and -10.5%, respectively, on the same day. GT is trading 10.4% above its 20-day moving average, 8.3% above its 50-day moving average, and 3.4% below its 200-day moving average.
Related ETFs and peers
The Schwab US Mid-Cap ETF (SCHM) invests 0.27% of its holdings in GT. The ETF tracks a market-cap-weighted index of midcap stocks in the Dow Jones US Total Stock Market Index. The YTD price movement of SCHM was 9.4% on July 27.
The SPDR S&P 500 ETF (SPY) invests 0.04% of its holdings in GT. The ETF tracks a market-cap-weighted index of US large and mid-cap stocks selected by the S&P committee.
The market caps of GT’s competitors are as follows:
Performance of Goodyear Tire & Rubber in 2Q16
Goodyear Tire & Rubber reported 2Q16 net sales of $3.9 billion, a fall of 7.1% from the net sales of $4.2 billion in 2Q15. The company’s cost of goods sold as a percentage of net sales rose by 0.51% between 2Q15 and 2Q16.
Its net income and EPS (earnings per share) rose to $202.0 million and $0.75, respectively, in 2Q16, compared with $192.0 million and $0.70 in 2Q15. It reported adjusted EPS of $1.16 in 2Q16, a rise of 38.1% over 2Q15.
GT’s cash and cash equivalents fell by 22.9%, and its inventories rose by 9.0% between 4Q15 and 2Q16. Its current ratio rose to 1.4x and its debt-to-equity ratio fell to 2.8x in 2Q16 ,compared with 1.2x and 3.0x, respectively, in 4Q15.
Quarterly dividends
Goodyear Tire & Rubber has declared a quarterly dividend of $0.07 per share on its common stock. The dividend will be paid on September 1, 2016, to shareholders of record at the close of business on August 1, 2016.
Projections
The company has reaffirmed its projections for 2016.
- Core segment operating income growth is expected to be in the range of 10% to 15%, which excludes Venezuela.
- Free cash flow from operations is expected to be positive.
- The adjusted debt-to-EBITDAP (earnings before interest, tax, depreciation, amortization, and pension income) multiple is expected to be in the range of 2.0x to 2.1x at the end of the year.
In the next part, we’ll discuss Domtar (UFS).
