How Did Domtar Perform in 2Q16?
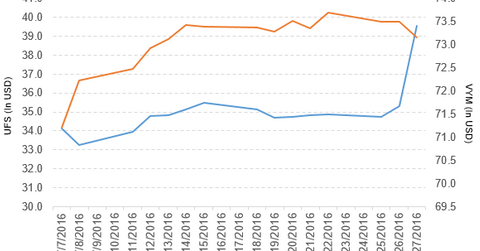
Domtar (UFS) has a market cap of $2.5 billion. It rose by 11.9% to close at $39.53 per share on July 27, 2016.
July 29 2016, Published 1:17 p.m. ET

Price movement
Domtar (UFS) has a market cap of $2.5 billion. It rose by 11.9% to close at $39.53 per share on July 27, 2016. The stock’s weekly, monthly, and year-to-date (or YTD) price movements were 13.8%, 18.6%, and 9.4%, respectively, on the same day. UFS is trading 14.2% above its 20-day moving average, 9.5% above its 50-day moving average, and 8.3% above its 200-day moving average.
Related ETFs and peers
The Vanguard High Dividend Yield ETF (VYM) invests 0.03% of its holdings in Domtar. The ETF tracks the FTSE High Dividend Yield Index. The index selects high-dividend-paying US companies, excluding REITS, and weights them by market cap. The YTD price movement of VYM was 11.3% on July 27.
The iShares MSCI KLD 400 Social ETF (DSI) invests 0.03% of its holdings in Domtar. The ETF tracks a market-cap-weighted index of 400 companies deemed to have positive environmental, social, and governance characteristics by the MSCI (Metals Service Center Institute).
The market caps of Domtar’s competitors are as follows:
Performance of Domtar in 2Q16
Domtar reported 2Q16 consolidated sales of $1.27 billion, a fall of 3.3% from the consolidated sales of $1.31 billion in 2Q15. Sales of the pulp and paper segment fell by 5.0% and sales of the personal care segment rose by 5.6%, between 2Q15 and 2Q16. The company’s cost of sales, excluding depreciation and amortization and operating income, fell by 0.44% and 37.1%, respectively, between 2Q15 and 2Q16. It reported closure and restructuring costs of $21.0 million in 2Q16, compared with $1.0 million in 2Q15. Its net income and EPS (earnings per share) fell to $18.0 million and $0.29, respectively, in 2Q16, compared with $38.0 million and $0.60, respectively, in 2Q15.
UFS’s cash and cash equivalents and inventories fell by 11.9% and 1.7%, respectively, between 4Q15 and 2Q16. Its current ratio rose to 1.99x and its debt-to-equity ratio fell to 1.12x in 2Q16, compared with 1.97x and 1.13x, respectively, in 4Q15.
In the next part of this series, we’ll discuss Allison Transmission Holdings.
