What Does Falling Water Usage Mean for Water Utilities?
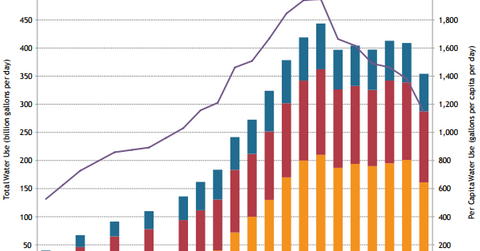
According to data released by the United States Geological Survey (or USGS), national water usage experienced a sharp drop between 2005 and 2010.
July 8 2016, Updated 9:07 a.m. ET

Falling total water use in the US
According to data released by the United States Geological Survey (or USGS), national water usage experienced a sharp drop between 2005 and 2010. Total water use in the US fell despite strong population growth. Increasing efficiency was one of the major reasons behind falling water usage. Between 2005 and 2010, water usage fell by nearly 13%.
Falling water usage creates headwinds for water utilities’ (PHO) organic growth. Aqua America (WTR), American States Water (AWR), and American Water Works (AWK) may see some pressure on their top lines if water usage keeps falling.
USGS produces water-related data every five years and the latest data available is until 2010. Data for 2010–2015 will be released this month.
Economic productivity of water
The graph above shows the economic productivity of water between 1900 and 2010. It shows inflation-adjusted gross domestic product for every 100 gallons of water used. We can see substantial growth in economic productivity since 1980. The graph shows that the US now uses far less water for economic activity than any time in the past.
