Campbell Soup Announces Its Target and Strategies
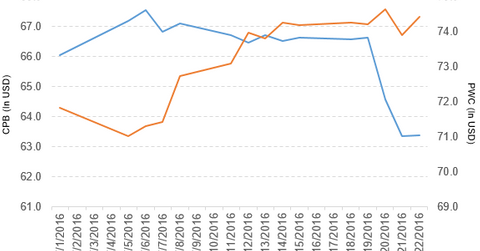
Campbell Soup fell by 4.9% to close at $63.38 per share in the third week of July. Its weekly, monthly, and YTD price movements were -4.9%, 1.7%, and 22.5%.
July 26 2016, Updated 9:07 a.m. ET

Price movement
Campbell Soup (CPB) fell by 4.9% to close at $63.38 per share during the third week of July 2016. The stock’s weekly, monthly, and YTD (year-to-date) price movements were -4.9%, 1.7%, and 22.5%, respectively, as of July 22. CPB is trading 3.0% below its 20-day moving average, 0.06% below its 50-day moving average, and 9.8% above its 200-day moving average.
Related ETF and peers
The PowerShares Dynamic Market Portfolio ETF (PWC) invests 0.55% of its holdings in Campbell Soup. The ETF tracks a quant-selected, tier-weighted index covering the entire US equity market. The YTD price movement of PWC was 2.4% on July 22.
The market caps of Campbell Soup’s competitors are as follows:
Campbell Soup’s plans
Campbell Soup has planned to strengthen its business in an effort to “elevate trust through real food, transparency, and sustainability.” It also plans to “build digital and e-commerce capabilities,” to “continue to diversify Campbell’s portfolio in health and well-being with fresh, organic and healthful foods,” and to “expand Campbell’s presence in developing markets.”
Campbell Soup’s performance in fiscal 3Q16
Campbell Soup reported fiscal 3Q16 total sales of $1.87 billion, a fall of 1.6%, as compared to total sales of $1.9 billion in fiscal 3Q15. Sales from Americas Simple Meals and Beverages and Global Biscuits and Snacks fell by 3.0% and 2.4%, respectively, and sales from Campbell Fresh rose by 6.5% in fiscal 3Q16 over fiscal 3Q15.
The company’s net income and EPS (earnings per share) rose to $185.0 million and $0.59, respectively, in fiscal 3Q16, as compared to $179.0 million and $0.57, respectively, in fiscal 3Q15. It reported adjusted EPS of $0.65, a fall of 1.5% as compared to fiscal 3Q15.
Campbell Soup’s cash and cash equivalents rose by 66.5% in fiscal 3Q16 over fiscal 3Q15. Its current ratio rose to 0.86x, and its debt-to-equity ratio fell to 2.2x in fiscal 3Q16, as compared to a current ratio and a debt-to-equity ratio of 0.82x and 2.4x, respectively, in fiscal 3Q15.
Projection
The company has revised the following projections for fiscal 2016:
- net sales growth between -2% and -1%, which reflects the impact of the recall of Bolthouse Farms protein drinks and the related production outage, and the impact of a major carrot customer moving to a dual source management (this guidance also includes the benefit of 1-point from the acquisition of Garden Fresh Gourmet and a negative impact of 2-point from currency translation)
- adjusted EBIT (earnings before interest and tax) growth in the range of 11%–13%
- adjusted EPS in the range of $2.93–$3.00.
- cash flow from operations of ~$1.3 billion
- current cost savings initiatives to deliver $300 million in annual savings by fiscal 2018
Drivers for fiscal 2017
The company expects a total cost of products sold inflation of ~2%, which includes higher wage and benefit costs and the adverse impact of the stronger US dollar on the input costs of its international businesses.
It expects to deliver incremental savings of ~$50 million in fiscal 2017 under its cost-saving initiatives and expects increased strategic share repurchases.
The company has following expectations for long-term:
- organic sales growth: 1%–3%
- adjusted EBIT (earnings before interest and tax) growth: 4%–6%
- adjusted EPS growth: 5%–7%
In the next part of the series, we’ll discuss General Motors.
