Avery Dennison’s Top and Bottom Lines Rose in 2Q16
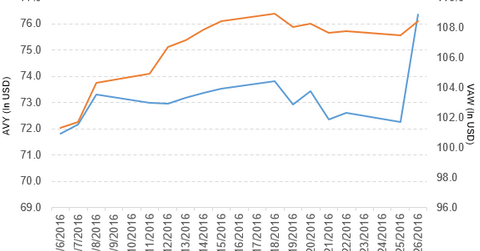
Avery Dennison (AVY) has a market cap of $6.8 billion. It rose by 5.7% to close at $76.37 per share on July 26, 2016.
Nov. 20 2020, Updated 11:25 a.m. ET

Price movement
Avery Dennison (AVY) has a market cap of $6.8 billion. It rose by 5.7% to close at $76.37 per share on July 26, 2016. The stock’s weekly, monthly, and year-to-date (or YTD) price movements were 4.8%, 3.7%, and 23.2%, respectively, on the same day. AVY is trading 5.0% above its 20-day moving average, 2.9% above its 50-day moving average, and 13.1% above its 200-day moving average.
Related ETFs and peers
The Vanguard Materials ETF (VAW) invests 0.79% of its holdings in Avery Dennison. The ETF tracks a very broad market-cap-weighted index of US materials companies. The YTD price movement of VAW was 16.1% on July 26.
The Vanguard Mid-Cap Value ETF (VOE) invests 0.33% of its holdings in Avery Dennison. The ETF tracks the CRSP US Mid-Cap Value Index, which classifies value stocks based on five value factors.
The market caps of Avery Dennison’s competitors are as follows:
Performance of Avery Dennison in fiscal 2Q16
Avery Dennison reported fiscal 2Q16 net sales of $1.54 billion, a rise of 1.7% over the net sales of $1.52 billion in fiscal 2Q15. Sales from the pressure-sensitive materials and Vancive Medical Technologies segments rose by 2.8% and 1.7%, respectively, and sales from the retail branding and information solutions segments fell by 1.5% between fiscals 2Q15 and 2Q16. The company’s gross profit margin rose by 2.2%. Its net income and EPS (earnings per share) rose to $80.0 million and $0.88, respectively, in fiscal 2Q16, compared with $63.7 million and $0.68, respectively, in fiscal 2Q15.
AVY’s cash and cash equivalents fell by 4.3% and its inventories rose by 2.3% between fiscals 2Q15 and 2Q16. Its current ratio fell to 1.2x and its debt-to-equity ratio rose to 3.5x in fiscal 2Q16, compared with 1.3x and 3.0x, respectively, in fiscal 2Q15. It reported non-GAAP (generally accepted accounting principles) free cash flow of $189.0 million in fiscal 2Q16, a rise of 41.9% over fiscal 2Q15. During fiscal 2Q16, the company repurchased 0.9 million shares worth of $64 million.
Avery Dennison reported that “in the second quarter, the company realized approximately $21 million in pre-tax savings from restructuring, net of transition costs, and incurred pre-tax restructuring charges of approximately $6 million, approximately two-thirds of which represented cash charges.”
Projections
The company projects EPS in the range of $3.35 to $3.50 for fiscal 2016. It also expects adjusted EPS in the range of $3.80 to $3.95, which excludes $0.15 per share for restructuring charges and other items, and $0.30 per share for non-cash charges to settle US pension obligations for fiscal 2016. For an ongoing analysis of this sector, please visit Market Realist’s Consumer Discretionary page.
