Why Did PVH Issue Senior Notes?
PVH (PVH) rose by 2.1% to close at $98.63 per share at the end of the third week of June 2016.
June 20 2016, Published 11:54 a.m. ET

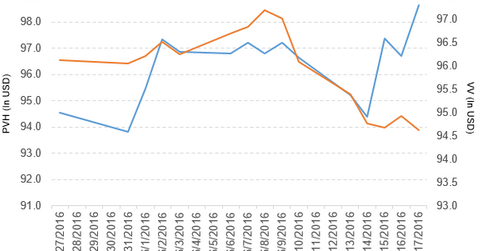
Price movement of PVH
PVH (PVH) rose by 2.1% to close at $98.63 per share at the end of the third week of June 2016. The stock’s weekly, monthly, and year-to-date (or YTD) price movements were 2.1%, 14.7%, and 34.0%, respectively. This means that PVH is trading 4.8% above its 20-day moving average, 5.7% above its 50-day moving average, and 10.5% above its 200-day moving average.
Related ETF and peers
The Vanguard Large-Cap ETF (VV) invests 0.05% of its holdings in PVH. The ETF tracks a market-cap-weighted index that covers 85% of the market capitalization of the US equity market. The YTD price movement of VV was 1.7% on June 17, 2016.
The market caps of PVH’s competitors are as follows:
PVH priced senior notes
PVH has launched an offer to sell 350 million euros as the principal amount of senior notes due in 2024, which will likely benefit from the current favorable interest rate environment. These notes will have an interest rate of 3.6% per year. The net proceeds of the offering will be used for general corporate purposes and to pay related transaction fees and expenses.
Performance of PVH in fiscal 1Q16
PVH reported fiscal 1Q16 total revenue of $1.92 billion, a rise of 2.0% compared to total revenue of $1.88 billion in fiscal 1Q15. Revenue from the Calvin Klein and Tommy Hilfiger segments rose by 10.5% and 3.2%, respectively. Revenue from Heritage Brands fell by 12.0% in fiscal 1Q16 compared to fiscal 1Q15.
The company’s net income and EPS (earnings per share) rose to $231.6 million and $2.83, respectively, in fiscal 1Q16 compared to $114.1 million and $1.37, respectively, in fiscal 1Q15.
PVH’s cash and cash equivalents fell by 12.9%, and its inventories rose by 9.2% in fiscal 1Q16 compared to fiscal 1Q15. Its debt-to-equity ratio fell to 1.2x in fiscal 1Q16 compared to 1.4x in fiscal 1Q15.
Projections
PVH has made the following projections for fiscal 2016:
- revenue growth of ~2% based on a constant currency and GAAP basis
- net interest expense in the range of $117.0 million–$120.0 million
- free cash flow of ~$500 million
- non-GAAP EPS in the range of $6.45–$6.55, which includes the negative impact related to foreign currency exchange rates of ~$1.55 per share
- an effective tax rate of ~20%
The company has made the following projections for fiscal 2Q16:
- revenue growth of ~5% on a constant currency basis
- net interest expense in the range of $26.0 million–$28.0 million
- non-GAAP EPS in the range of $1.25–$1.30, which includes the negative impact related to foreign currency exchange rates of ~$0.45 per share
- an effective tax rate in the range of 24%–25%
In the next part, we’ll take a look at Newell Brands.
