How Do Johnson & Johnson’s Valuations Compare to Peers?
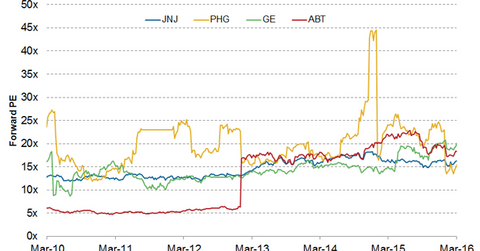
On March 17, 2016, Johnson & Johnson (JNJ) was trading at a forward PE (price-to-earnings) multiple of ~16.5x compared to the industry average of ~19.6x.
March 21 2016, Updated 3:55 a.m. ET

Peer comparison
On March 17, 2016, Johnson & Johnson (JNJ) was trading at a forward PE (price-to-earnings) multiple of ~16.5x compared with the industry average of ~19.6x. The company is trading at lower multiples than peers General Electric (GE) and Abbott Laboratories (ABT), which are trading at forward PE multiples of 20.1x and 18.8x, respectively, but at a higher forward PE multiple than Philips (PHG), which is trading at 15.4x. The forward price-to-earnings ratio is used to compare the current market price with the expected earnings per share of a company.
Stock price performance
As of March 16, 2016, Johnson & Johnson’s share price was $107.41, representing a rise of 6.1% since the company’s 4Q earnings release on January 26, 2016. The stock traded at a 52-week high of $108.35 on March 15, 2016, and at a 52-week low of $81.18 on August 24, 2015.
The stock prices and valuations of Johnson & Johnson continue to be negatively impacted by currency headwinds, the divestiture of its interventional vascular technology manufacturing business division, and competition in the hepatitis C disease segment. However, the company’s diversified operations with leading positions in all the three businesses that it operates in, its excellent operational performance, its strong product line, and attractive dividend payout ratio of ~50% with a continuously increasing dividend payment record of 53 years make Johnson & Johnson an attractive long-term investment.
Johnson & Johnson’s fundamentals
In 2015, Johnson & Johnson witnessed a 5.7% revenue decline on a YoY (year-over-year) basis, in part due to the negative impact from foreign exchange of ~7.5%. Excluding the impact of foreign exchange, the Cordis divestiture, and competition in the hepatitis C disease segment, the company registered worldwide operational sales growth of ~6.5%. The consumer segment, pharmaceutical, and medical device segments sales rose 1.8%, 6.5%, and 3.4%, respectively, on an operational basis.
Momentum in the consumer segment and restructuring initiatives for the medical device segment is expected to boost future sales and profitability of the company. Johnson & Johnson is focused on restructuring its medical device business segment, as the company aims to better align its operations with the changing trends in the medical device industry.
Investors can invest in the iShares U.S. Healthcare ETF (IYH) for diversified exposure to Johnson & Johnson, which accounts for approximately 10.9% of IYH’s total holdings.
