What Drove Under Armour’s Rise on June 8?
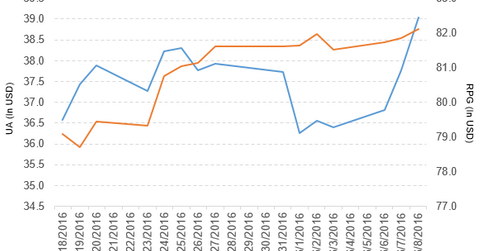
Under Armour (UA) has a market cap of $7.1 billion. It rose by 3.4% to close at $39.04 per share on June 8, 2016.
June 9 2016, Published 3:36 p.m. ET

Price movement
Under Armour (UA) has a market cap of $7.1 billion. It rose by 3.4% to close at $39.04 per share on June 8, 2016. The stock’s weekly, monthly, and YTD (year-to-date) price movements were 7.7%, 0.88%, and -3.1%, respectively, that day. This means that UA is trading 4.4% above its 20-day moving average, 4.2% below its 50-day moving average, and 9.1% below its 200-day moving average.
Related ETF and peers
The Guggenheim S&P 500 Pure Growth ETF (RPG) invests 1.2% of its holdings in Under Armour. The ETF tracks an index of primarily large- and mid-cap companies with strong growth characteristics. The index selects companies from the S&P 500 based on three growth factors. The YTD price movement of RPG was 1.8% as of June 8, 2016.
The market caps of Under Armour’s competitors are as follows:
Under Armour rises after sale of bonds
Under Armour rose by more than 3.4% on June 8, 2016, after Standard & Poor’s rated Under Armour as “BBB-” (investment grade). This rating comes after Under Armour sold $600 million in bonds in its first offering. The net proceeds from this offering will be used to repay debt under the company’s revolving credit facility. Standard & Poor’s has given Under Armour a stable rating outlook.
Performance of Under Armour in 1Q16
Under Armour (UA) reported 1Q16 net revenues of $1.1 billion, a rise of 30.2% over its 1Q15 net revenues of $804.9 million. Revenues from its Apparel, Footwear, Accessories, Licensing, and Connected Fitness segments rose by 20.0%, 64.2%, 26.2%, 14.7%, and 119.4%, respectively, between 1Q15 and 1Q16.
The company’s cost of goods sold as a percentage of net revenue and income from operations rose by 1.9% and 26.0%, respectively, between 1Q15 and 1Q16. In 1Q16, its net income and EPS (earnings per share) rose to $19.2 million and $0.04, respectively, compared with the $11.7 million and $0.03 the company saw in 1Q15.
Under Armour’s cash and cash equivalents and inventories rose by 20.9% and 6.6%, respectively, between 4Q15 and 1Q16. In 1Q16, its current ratio fell to 2.9x and its debt-to-equity ratio rose to 0.85x, compared with a current ratio and a debt-to-equity ratio of 3.1x and 0.72x in 4Q15.
Projections
For 2016, Under Armour (UA) has issued the following revised projections:
- net revenues: ~$4.9 billion
- operating income: $440 million–$445 million
- interest expense: ~$35 million
- effective tax rate: ~38.5%
- fully diluted weighted average shares outstanding: ~446 million of the Class C stock dividend
For 2Q16, Under Armour (UA) has issued the following revised projections:
- an impairment charge of ~$23 million related to the closing of retailer Sports Authority
- revenue growth in the high 20% range
- operating income of $17 million–$19 million
- tax rate of ~70%
These projections include the bankruptcy and liquidation of the Sports Authority retail chain. In the next part, we’ll look at Philip Morris International.
