Under Armour Saw Its Price Target after Its Revised Outlook
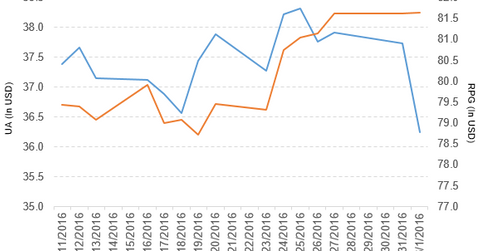
Under Armour (UA) has a market cap of $6.6 billion. It fell by 3.9% to close at $36.25 per share on June 1, 2016.
June 2 2016, Published 5:57 p.m. ET

Price movement of Under Armour
Under Armour (UA) has a market cap of $6.6 billion. It fell by 3.9% to close at $36.25 per share on June 1, 2016. The stock’s weekly, monthly, and year-to-date (or YTD) price movements were -5.2%, -17.1%, and -10.1%, respectively, on that date.
This means that UA is trading 5.1% below its 20-day moving average, 12.2% below its 50-day moving average, and 16.3% below its 200-day moving average.
Related ETF and peers
The Guggenheim S&P 500 Pure Growth ETF (RPG) invests 1.2% of its holdings in Under Armour. This ETF tracks an index of primarily large-cap and midcap companies with strong growth characteristics. The index selects companies from the S&P 500 Index, based on three growth factors. The YTD price movement of RPG was 1.2% on June 1, 2016.
The market caps of Under Armour’s competitors are as follows:
Under Armour saw price target cut
Telsey Advisory reduced its Under Armour price target to $49 from $53 per share. Susquehanna Financial also lowered the stock price target to $40 from $44 per share.
Jefferies cut the stock price target to $42 from $45 per share. Cowen lowered the price target to $42 from $51 per share. The price target was reduced after the revised outlook from Under Armour for 2016.
Performance of Under Armour in 1Q16
Under Armour (UA) reported 1Q16 net revenue of $1.1 billion, a rise of 30.2% compared to net revenue of $804.9 million in 1Q15. Revenues from its Apparel, Footwear, Accessories, Licensing, and Connected Fitness segments rose by 20.0%, 64.2%, 26.2%, 14.7%, and 119.4%, respectively, in 1Q16 compared to 1Q15.
The company’s cost of goods sold as a percentage of net revenue and income from operations rose by 1.9% and 26.0%, respectively, in 1Q16 compared to 1Q15.
UA’s net income and EPS (earnings per share) rose to $19.2 million and $0.04, respectively, in 1Q16. This is compared to $11.7 million and $0.03, respectively, in 1Q15.
Under Armour’s cash and cash equivalents and inventories rose by 20.9% and 6.6%, respectively, in 1Q16 compared to 4Q15. Its current ratio fell to 2.9x, and its debt-to-equity ratio rose to 0.85x in 1Q16. This compares to its current ratio and debt-to-equity ratio of 3.1x and 0.72, respectively, in 4Q15.
Projections
For 2016, Under Armour (UA) issued the following revised projections:
- net revenues: ~$4.9 billion
- operating income: ~$440 million–$445 million
- interest expense: ~$35 million
- effective tax rate: ~38.5%
- fully diluted weighted average shares outstanding: ~446 million of the Class C stock dividend
For 2Q16, Under Armour (UA) issued the following revised projections:
- UA expects an impairment charge of ~$23 million related to the closure of retailer Sports Authority.
- UA expects revenue growth in the high 20% range.
- The company expects operating income of $17 million–$19 million.
- UA expects a tax rate of ~70%.
These projections include the bankruptcy and liquidation of the Sports Authority retail chain.
In the next part, we’ll take a look at General Motors.
