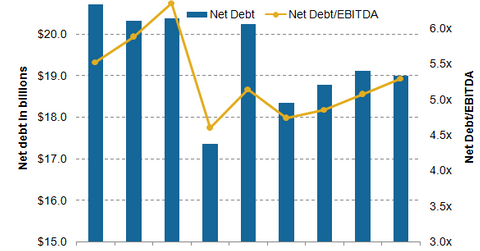
Inside PPL Corporation’s Debt Profile in 1H16
At the end of the first quarter of 2016, PPL’s total debt stood at $19.8 billion. Of this amount, $18 billion was long-term debt.
June 6 2016, Updated 3:06 p.m. ET

PPL’s debt profile
According to PPL Corporation’s (PPL) management, the company estimates that it will generate $1.3 billion in cash for distribution in 2016. As it intends to use almost all this cash for dividends, any capital expenditure for the period is likely to come from debt financing. This, in turn, could increase the leverage of the company.
At the end of the first quarter of 2016, PPL’s total debt stood at $19.8 billion. Of this amount, $18 billion was long-term debt. The company’s debt-to-equity ratio is 2x while its debt-to-market capitalization is 0.8x.
Leverage
As of March 31, 2016, PPL’s net debt-to-EBITDA (earnings before interest, tax, depreciation, and amortization) ratio was 5.3x. The net debt-to-EBITDA ratio shows how many years it will take a company to repay its debt based on EBITDA. As utilities are asset-rich businesses with heavy debt, leverage is an important metric for analyzing them. PPL’s net debt-to-EBITDA ratio is higher than Duke Energy’s (DUK) ratio of 5x and PG&E’s (PCG) ratio of 4.1x.
By comparison, the debt-to-asset ratio represents the portion of a company’s assets that are financed by debt. This metric also assesses a company’s financial risk. Notably, PPL has a debt-to-asset ratio of 0.5x, as compared to Duke Energy’s debt-to-asset ratio of 0.4x and PG&E’s ratio of 0.3x.
Credit rating
PPL benefits from strong regulated operations that provide earnings stability and cash flow predictability. Given PPL’s credit profile, Standard & Poor’s has given it a rating of “A-” and has a stable outlook. As for peers, Duke has a negative outlook and a rating of “A-.” PG&E Corporation has a positive outlook and a credit rating of “BBB.”
Now it’s time to talk about currency headwinds for PPL.
