What Do the PCE Price Index and Break-Even Inflation Indicate?
The PCE price index is the Federal Reserve’s preferred measure of inflation because it covers the broadest set of goods and services.
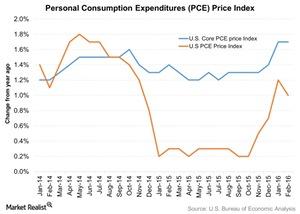
Nov. 20 2020, Updated 3:58 p.m. ET
PCE price index
The personal consumption expenditure (or PCE) price index measures the percentage of change in the prices of goods and services purchased by consumers throughout the economy. It’s one measure of inflation in the United States.
The PCE price index is the Federal Reserve’s preferred measure of inflation because it covers the broadest set of goods and services. According to the Fed, PCE is the “most consistent over the longer run with the US Federal Reserve’s statutory mandate.”
The US Federal Reserve is mandated by Congress to maintain PCE inflation at 2% in the long term. Core PCE, which excludes food and fuel prices, rose 1.7% year-over-year (or YoY) in February 2016. The PCE price index rose 1.0% YoY in February, a fall from 1.2% in the previous month.
As you can see in the graph above, the PCE indicator has been below its target level due to the fall in crude oil prices, which has impacted energy companies such as ExxonMobil (XOM), ConocoPhillips (COP), Chevron (CVX), and Royal Dutch Shell (RDS.A).
The fall in crude oil prices is the primary reason for the fall in PCE inflation. However, PCE started picking up in November 2015 after a rebound in oil prices and better domestic economic data.
Break-even inflation
The breakeven inflation rate is a market-based measure of expected inflation. It’s the difference between the yield of a nominal bond and an inflation-linked bond of the same maturity.
Breakeven inflation analysis helps investors to decide on whether to take exposure to Treasury inflation-protected securities (or TIPS) or not. Investors can simply compare their own inflation expectations versus the Market’s by using the breakeven inflation rate as a proxy for the Market’s expectation.
For example, if the breakeven inflation rate is 2.0%, and your expected inflation is higher, you would purchase TIPS. Higher inflation expectations would result in higher interest income and a rise in principal. Thus, the investor would see a higher total return.
On the other hand, if your expected inflation is lower than 2.0%, you would not buy TIPS, because lower inflation expectations would result in a lower total return to the investor.
Investors’ takeaway
The US labor market is getting stronger, and wage growth is improving. This could lead to people’s spending more, especially on discretionary items. A rise in demand from the masses would help to stoke inflation. Further, the manufacturing sector has also expanded, indicating that the US industrial sector is improving. The industrial sector has been impacted by a strong dollar and sluggish global demand.
The US economic engine should keep chugging, and inflation could see an uptick in the short term. If that happens, it would be beneficial to invest in TIPS. Funds such as the iShares TIPS Bond ETF (TIP), the Fidelity Inflation-Protected Bond Fund (FINPX), and the PIMCO 15+ Year US TIPS ETF (LTPZ) provide exposure to TIPS.
For more analysis on mutual funds, please visit Market Realist’s Mutual Funds page.