Henkel Acquired Procter & Gamble’s Haircare Brands
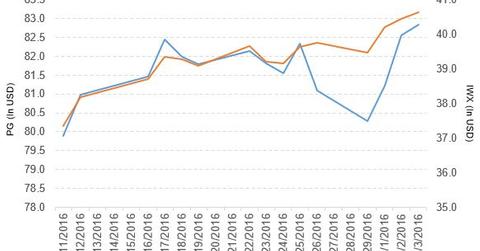
Procter & Gamble (PG) has a market cap of $224.1 billion. PG rose by 0.35% to close at $82.84 per share on March 3, 2016.
Nov. 20 2020, Updated 4:07 p.m. ET

Price movement of Procter & Gamble
Procter & Gamble (PG) has a market cap of $224.1 billion. PG rose by 0.35% to close at $82.84 per share on March 3, 2016. The price movement on a weekly, monthly, and year-to-date (or YTD) basis is 0.61%, 3.3%, and 5.2%, respectively.
Currently, PG is trading 1.6% above its 20-day moving average, 4.4% above its 50-day moving average, and 9.0% above its 200-day moving average.
The iShares Russell Top 200 Value ETF (IWX) invests 3.1% of its holdings in PG. The ETF tracks an index of US large-cap value stocks. The index selects from stocks ranked 1–200 by market cap based on two style factors. The YTD price movement of IWX was -3.1% as of March 2, 2016.
The market caps of Procter & Gamble’s competitors are as follows:
Acquisition of Procter & Gamble’s haircare brands
Germany’s Henkel, maker of Schwarzkopf shampoo and Loctite glue, has agreed to buy a range of haircare brands from Procter & Gamble for $100 million. The acquisition focuses on emerging markets and generating annualized sales. The deal includes brands like Pert, Shamtu, and Blendax in countries like Russia, Saudi Arabia, and Turkey.
On March 2, 2016, the company announced the sales of Hipoglos diaper rash cream brand in Brazil to Johnson & Johnson. The transaction will be closed in the next four to six months subject to necessary regulatory approvals.
Performance of Procter & Gamble in recent fiscal 2Q16
Procter & Gamble reported fiscal 2Q16 net sales of $16,915.0 million, a fall of 8.5% compared to net sales of $18,495.0 million in fiscal 2Q15. Sales of the beauty, grooming, healthcare, fabric care & home care, and baby, feminine & family care segments fell by 10%, 10%, 5%, 7%, and 10%, respectively, in fiscal 2Q16.
The company’s net income and EPS (earnings per share) rose to $3,206.0 million and $1.12, respectively, in fiscal 2Q16, compared to $2,372.0 million and $0.82, respectively, in fiscal 2Q15.
Meanwhile, its cash and cash equivalents and inventories rose by 37.6% and 2.9%, respectively, in fiscal 2Q16. The company’s current ratio and debt-to-equity ratio rose to 1.1x and 1.07x, respectively, in fiscal 2Q16.
The price-to-earnings and price-to-book value ratios of Procter & Gamble are 27.3x and 3.7x, respectively, as of March 3, 2016.
Projections
The company has made the following projections for fiscal 2016:
- All-in sales will be down to high-single digits, which includes a negative 7% foreign exchange impact and a 2%–3% impact from the combined effects of the Venezuela deconsolidation and minor brand divestitures.
- Core EPS including foreign exchange impact is projected to be down 3%–8%.
- It expects to pay dividends of more than $7 billion for a total of $15 billion to $16 billion in dividend payments, share exchanges, and share repurchases.
Keep checking in with Market Realist’s Consumer Discretionary page for ongoing analysis.
