PACCAR’s Revenue and Income Rose in 2015
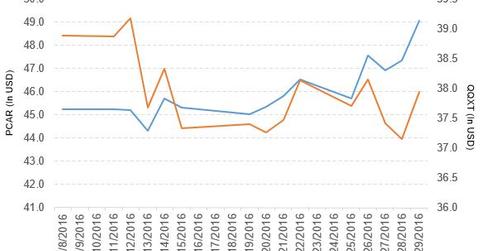
PACCAR (PCAR) rose by 5.5% to close at $49.07 per share at the end of the last week of January 2016.
Feb. 2 2016, Updated 11:32 a.m. ET

Price movement of PACCAR
PACCAR (PCAR) rose by 5.5% to close at $49.07 per share at the end of the last week of January 2016. The stock’s price movements on a weekly, monthly, and year-to-date (or YTD) basis are 5.5%, 1.4%, and 3.5%, respectively.
At times, the stock has broken the support of all of its moving averages. Currently, PCAR is trading 6.2% above its 20-day moving average, 3.6% above its 50-day moving average, and 12.0% below its 200-day moving average.
The First Trust NASDAQ-100 Ex-Technology Sector Index ETF (QQXT) invests 1.7% of its holdings in PACCAR. The ETF tracks an equal-weighted index of NASDAQ-100 stocks that excludes technology companies. The YTD price movement of QQXT is -10.4% as of January 28, 2016.
The market capitalizations of PACCAR’s competitors are as follows:
Performance of PACCAR in 4Q15 and 2015
PACCAR reported 4Q15 truck, parts, and other net sales and revenue of $4,062.5 million, a fall of 15.7% compared to net sales of $4,817.1 million in 4Q14. It reported financial services revenue of $292.8 million in 4Q15, a fall of 3.0% compared to 4Q14. The company has delivered 16,000, 15,000, and 4,500 new trucks in the United States and Canada, Europe, and other geographies, respectively, in 4Q15.
PCAR’s net income and EPS (earnings per share) fell to $347.2 million and $0.98, respectively, in 4Q15, compared to $394.3 million and $1.11, respectively, in 4Q14.
The company has declared a quarterly dividend of $1.64 per share on its common stock.
2015 results
In 2015, PCAR reported truck, parts and other net sales and revenues of $18,000.0 million, a rise of 0.84% YoY (year-over-year). Revenue from its financial services segment fell by 2.6% in 2015. Its net income and EPS rose to $1,604.0 million and $4.51, respectively, in 2015, compared to $1,358.8 million and $3.82, respectively, in 2014.
Meanwhile, its cash and marketable debt securities rose by 15.0%, and its inventories fell by 14.0% in 2015. The liabilities of its financial services segment rose by 3.3% in 2015. New trucks delivered rose by 7.7% and 20% in the United States and Canada and Europe, respectively.
PACCAR repurchased 3.9 million of its common shares for $201.6 million in 2015.
The price-to-earnings and price-to-book value ratios of PACCAR are 10.6x and 2.4x, respectively, as of January 29, 2016.
