Overview of BP’s Refining Segment and Margins
BP’s refining segment has 2.0 million barrels per day of refining capacity worldwide. In the United States, it has around 0.74 MMbpd of refining capacity.
Jan. 19 2016, Updated 8:06 a.m. ET

BP’s refining segment
BP (BP) has 2.0 MMbpd (million barrels per day) of refining capacity worldwide. In the United States, BP has around 0.74 MMbpd of refining capacities located in the Northwest and east of the Rockies.
Around 0.85 MMbpd, another large portion of refining capacity, is located in Europe, spread out over Germany, the Netherlands, and Spain. BP has a combined capacity of 0.37 MMbpd in Australia, New Zealand, and South Africa.
BP’s peers ExxonMobil (XOM), Chevron (CVX), and Royal Dutch Shell (RDS.A) have refining capacities of 5.2 MMbpd, 1.9 MMbpd, and 3.1 MMbpd, respectively.
BP’s refining margin indicators
Income from refining operations is primarily dependent on refining margins and crack spreads. BP closely tracks refining margin market indicators such as the USMW (US Midwest), the USNWC (US Northwest Coast), the NWE (Northwest Europe), and the Med (Mediterranean).
The company also calculates RMM (refining marker margin). Per BP, “Refining marker margin, or RMM, is the average of regional indicator margins weighted for BP’s crude refining capacity in each region. Each regional marker margin is based on product yields and a marker crude oil deemed appropriate for the region. The regional indicator margins may not be representative of the margins achieved by BP in any period because of BP’s particular refinery configurations and crude and product slate.”
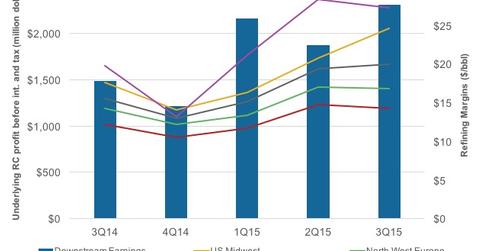
In 3Q15, downstream segment earnings rose by 55% when compared to 3Q14 due to widening refining margins. The USMW margin rose by $7 per barrel to $25 per barrel. USNWC margins rose by $8 per barrel to $27 per barrel. The NWE and Med margins rose by 17% each to $17 per barrel and $14 per barrel, respectively.
BP’s average RMM rose by $4 per barrel over 3Q14 to $20 per barrel in 3Q15. Total refining throughput fell marginally by 2% to 1.7 MMbpd.
If you’re looking for exposure to refining and marketing sector stocks, you may wish to consider the Vanguard Energy ETF (VDE). The ETF has ~11% exposure to refining sector stocks.
