How Do R&D Expenses Compare for Cisco, Juniper, and Palo Alto?
In 3Q15, Palo Alto’s (PANW) research and development (or R&D) expenses increased to $60 million from $37 million in 3Q14 and $20 million in 3Q13.
Dec. 10 2015, Published 2:36 p.m. ET

Palo Alto’s R&D expense as a percentage of revenues rose in 3Q15
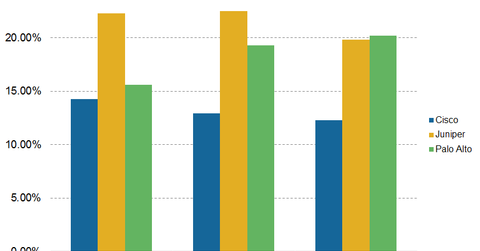
In 3Q15, Palo Alto’s (PANW) research and development (or R&D) expenses increased to $60 million from $37 million in 3Q14 and $20 million in 3Q13. Research and development expenses allocated comprised 20.2% of total revenues in 3Q15. In comparison, they comprised 15.6% and 19.3% of total revenues in 3Q13 and 3Q14, respectively.
Cisco’s R&D expense makes up 12.3% of revenues in 3Q15
In 3Q15, Cisco’s (CSCO) R&D expenses decreased YoY to $1.56 billion from $1.58 billion in 3Q14 and $1.7 billion in 3Q13. Research and development expenses allocated comprised 12.3% of total revenues in 3Q15. In comparison, the expenses comprised 14.2% and 12.9% of total revenues in 3Q13 and 3Q14, respectively.
Juniper’s R&D expense makes up 13.9% of revenues in 3Q15
In 3Q15, Juniper’s (JNPR) R&D expenses fell YoY to $247 million from $253 million in 3Q14 and $265 million in 3Q13. R&D expenses comprised 19.8% of total revenues in 3Q15. In comparison, they comprised 22.3% and 22.5% of total revenues in 3Q13 and 3Q14, respectively.
R&D is an important component of communications equipment companies. All firms invest heavily in R&D to introduce faster, better, and more secure network solutions to customers.
Palo Alto Networks makes up 4.5% of the PureFunds ISE Cyber Security ETF (HACK). Peer companies such as Cisco Systems (CSCO) and Juniper Networks (JNPR) make up 3.7% and 3.9% of the ETF, respectively. Palo Alto comprises 7.9% of the iShares North American Tech-Multimedia Networking ETF (IGN) as well.
