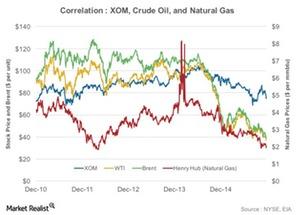
Correlation Analysis: ExxonMobil’s Crude Oil, Natural Gas prices
The correlation coefficients of ExxonMobil to Brent, West Texas Intermediate, and Henry Hub natural gas prices stand at 0.22, 0.35, and 0.36, respectively.
Dec. 25 2015, Updated 10:05 a.m. ET

What’s the correlation coefficient?
In this series, we analyzed ExxonMobil’s (XOM) stock movements, business segments, leverage, cash flows, and valuations. In this concluding part, we’ll test the correlation between XOM’s stock performance, crude oil, and natural gas prices. We have considered the past five years’ price history of XOM, Brent, WTI (West Texas Intermediate), and Henry Hub natural gas prices. It’s imperative here to understand the concept of the correlation coefficient. The CC (correlation coefficient) shows how strongly two variables are related to each other. The value of CC varies from negative one to positive one. A value between zero—one states positive correlation, zero states no correlation, and negative one—zero states inverse correlation.
Crude oil and natural gas prices
The correlation coefficients of XOM to Brent, WTI, and Henry Hub natural gas prices stand at 0.22, 0.35, and 0.36, respectively.
The earnings of integrated energy companies are affected by both the upstream and downstream segments. For the upstream segment, earnings are determined by the volumes produced and oil realizations, while, for the downstream segment, earnings are derived by the prices of the refined product, volumes processed, and costs of crude oil. Hence upstream gains from higher oil price, downstream losses from it, and vice versa. This provides integrated energy companies’ a degree of resistance to oil price volatility. This explains the low correlation between oil prices and XOM stock prices.
So, upstream gains from higher oil prices, downstream losses from them, and vice versa. This provides integrated energy companies a degree of resistance to oil price volatility and explains the low correlation between oil prices and XOM’s stock prices.
This is in contrast to pure upstream or downstream companies that show a strong correlation to oil prices. A case in point is Marathon Petroleum (MPC), a refining and marketing company that has a negative 0.4 correlation with Brent. This is due to the higher crude cost that led to lower earnings for refiners in the past four quarters. So, stock prices of refiners moved inversely compared to oil prices.
The iShares Global Energy ETF (IXC) has ~26% exposure to XOM and CVX. The ETF’s combined exposure to BP (BP), Royal Dutch Shell (RDS.A), ExxonMobil (XOM), and Chevron (CVX) stands at ~35%.
