MAA’s EBITDA Margin: Lower than Industry Average
MAA’s EBITDA margin is lower than the industry average of 57.7%, as well as the margins reported by some of the company’s peers.
Nov. 26 2015, Updated 10:05 a.m. ET

Cost structure
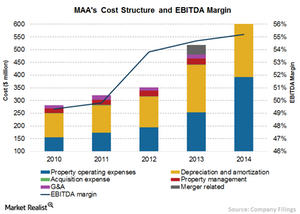
In order to boost its bottom line, MAA (MAA) has initiated cost control measures over the past few years. The company’s consolidated costs amounted to $761.1 million for fiscal 2014, up by 47% over 2013. This came on the back of a 47.1% rise in total costs in 2013. The sharp rise in operating expenses in 2013 and 2014 was mainly attributed to MAA’s merger with Colonial Property Trust in 2013.
Depreciation and amortization comprised 39.7% of the total costs in 2014 while property operating expenses comprised 51.5%, property management comprised 4.2%, and G&A (general and administrative expenses) amounted to 2.7% of the total costs.
Cost components
Property operating expenses increased by 54.9% in 2014 to $392.3 million. The increase in property operating expenses was primarily a result of increases in real estate taxes, the addition of Colonial’s portfolio after the merger, and acquisitions of other properties. Property operating expenses include the costs of property personnel, property personnel bonuses, building repairs and maintenance, real estate taxes, insurance, utilities, landscaping, and depreciation and amortization.
Depreciation expenses increased by 61.4% to $301.8 million in 2014, compared with a rise of 54.3% in 2013 to $187 million. The increase in depreciation and amortization expenses was mainly attributed to capital spending incurred during the year and the addition of Colonial’s portfolio after the merger.
G&A increased by 34.3% to $20.9 million in 2014 over 2013. The increase was mainly related to increases in incentive bonuses and payroll expenses due to the increased headcount resulting from the merger.
Lower EBITDA margin
MAA recorded an EBITDA (earnings before interest, tax, depreciation, and amortization) margin of 55.2% in 2014, compared with 54.7% in 2013 and 53.8% in 2012. MAA’s EBITDA margin is lower than the industry average of 57.7%, as well as the margins reported by some of the company’s peers. Equity Residential (EQR) reported the highest EBITDA margin of 64.4%, followed by AvalonBay Communities (AVB) at 63.6%, and UDR (UDR) at 59.9%. The SPDR Dow Jones REIT ETF (RWR) invests 1.1% of its portfolio in MAA. In the next article, we’ll discuss MAA’s funds from operations.
