Mutual Funds: A Comparative Analysis Using R-Squared Values
The R-squared value is a statistical measure that compares the movement of a fund against that of its benchmark index.
Nov. 20 2015, Updated 2:06 p.m. ET

R-squared value
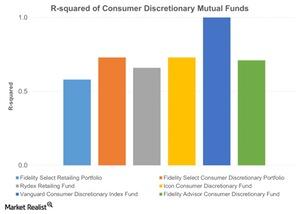
The R-squared value is a statistical measure that compares the movement of a fund against that of its benchmark index. The R-squared value ranges from 0 to 1. A value closer to 1 indicates that the fund’s performance follows the movement of the underlying index, whereas a fund with a low R-squared value does not closely follow the performance of the underlying index.
Comparison of the consumer discretionary mutual funds
With a perfect 1.0, the Vanguard Consumer Discretionary Index Fund (VCDAX) has the highest R-squared value. This means that the fund closely follows the performance of its underlying index, the MSCI US Consumer Discretionary IMI 25/50. The Fidelity Select Retailing Portfolio (FSRPX), which was the highest performer according to other measures, had an R-squared value of 0.58. This was the lowest among the funds we’ve looked at, which means that it is the least reflective of its underlying index.
The Vanguard Consumer Discretionary Index Fund
The Vanguard Consumer Discretionary Index (VCDAX) is a fully invested mutual fund. It is a low-cost fund and it invests in consumer discretionary companies regardless of their capitalization. The fund has returned 15.6% in the last year. The company’s top five holdings are Amazon.com (AMZN), The Walt Disney Company (DIS), The Home Depot (HD), Comcast (CMCSA), and McDonald’s (MCD). In the next article, we’ll have a look at the funds’ information ratios.
