How Does Lululemon Athletica Compare with Its Peers?
Lululemon Athletica has outperformed its competitors, based on gross profit margin, current ratio, and PE in 2Q15.
Nov. 20 2020, Updated 11:46 a.m. ET

Comparing Lululemon Athletica with its competitors
An analysis of Lululemon’s 2Q15 income statement follows:
The analysis of Lululemon’s balance sheet in 2Q15 follows:
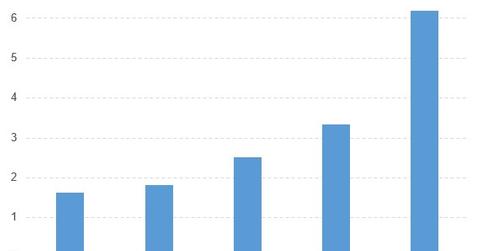
- The current ratios of Lululemon Athletica (LULU), Express (EXPR), The Gap (GPS), Zumiez (ZUMZ), and Nike (NKE) are 6.19, 1.63, 1.81, 3.34, and 2.52, respectively.
The analysis of Lululemon’s valuation follows:
- The PE (price-to-earnings) ratios of Lululemon Athletica (LULU), Express (EXPR), The Gap (GPS), Zumiez (ZUMZ), and Nike (NKE) are 28.63x, 18.44x, 12.32x, 14.62x, and 29.77x, respectively.
Lululemon Athletica has outperformed its competitors, based on gross profit margin, current ratio, and PE in 2Q15.
ETFs that invest in Lululemon Athletica
The Global X Guru International Index ETF (GURI) invests 2.40% of its holdings in Lululemon Athletica. The ETF tracks an index of US-listed international stocks, ADRs, and GDRs. The index screens hedge funds and the stocks they hold. Selected stocks are equally weighted.
The iShares Morningstar Mid-Cap Growth Index ETF (JKH) invests 0.46% of its holdings in Lululemon Athletica. The ETF tracks a market cap–weighted index of midcap companies selected by Morningstar based on their growth characteristics.
The Vanguard Mid-Cap Growth ETF (VOT) invests 0.38% of its holdings in Lululemon Athletica. The ETF tracks a market cap–weighted index of midcap growth companies selected by the Center for Research in Security Prices, located in Chicago, Illinois.
Comparison of ETFs that invest in Lululemon Athletica
An analysis of Lululemon’s price movement follows:
- The year-to-date price movements of Lululemon Athletica, the Global X Guru International Index ETF (GURI)(GURI)(GURI), the iShares Morningstar Mid-Cap Growth Index ETF (JKH), and the Vanguard Mid-Cap Growth ETF (VOT) are -4.03%, -13.36%, 1.10%, and 0.85%, respectively.
An analysis of Lululemon’s valuation follows:
- The PE (price-to-earnings) ratios of Lululemon Athletica, the Global X Guru International Index ETF (GURI)(GURI)(GURI), the iShares Morningstar Mid-Cap Growth Index ETF (JKH), and the Vanguard Mid-Cap Growth ETF (VOT) are 28.63x, 33.91x, 34.57x, and 31.43x, respectively.
These ETFs have outperformed Lululemon Athletica based on PE. However, Lululemon has outperformed the Global X Guru International Index ETF (GURI)(GURI)(GURI).
