Crude Oil Prices Rally despite the Iran Nuclear Accord
NYMEX-traded WTI (West Texas Intermediate) crude oil futures contracts for August delivery rose by 1.10% and settled at $53.04 per barrel on July 14, 2015.
Nov. 20 2020, Updated 4:49 p.m. ET

Crude oil prices rally
This series analyzes crude oil and natural gas prices and fundamentals. For an in-depth fundamental look at oil and gas and related companies, sectors, and drivers, please refer to our Energy and Power page.
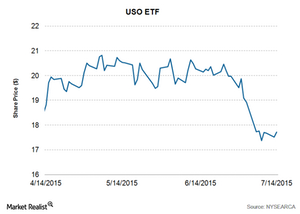
NYMEX-traded WTI (West Texas Intermediate) crude oil futures contracts for August delivery rose by 1.10% and settled at $53.04 per barrel on July 14, 2015. There was speculation of a delay in crude oil exports from Iran, even after the nuclear deal supported crude oil prices. The US benchmark following ETFs like the United States Oil Fund LP (USO) and the ProShares Ultra DJ-UBS Crude Oil (UCO) also followed the price trajectory of WTI’s price movement. They rose by 1.20% and 2.35%, respectively, on July 14, 2015.
Iran and global heavyweights entered into a nuclear accord on July 14, 2015. Iran has to abide by the nuclear accord, so that the global heavyweights lift the oil sanction. Lifting the sanction will allow Iran to step up its crude oil exports by 500,000 barrels of crude oil per day within six months. Iran exported 6 MMbpd (million barrels per day) in the 1970s.
Crude oil prices have fallen more than 10% since June 30, 2015. Iran’s nuclear deal has already priced in crude oil prices. As a result, the oil market didn’t react much to the Iran nuclear accord. Goldman Sachs estimates that it will take six months to one year for Iran to step up its production in the oversupplied oil market. However, massive oil inventories held by Iran could hit the oil market as soon as oil sanctions are lifted.
Yesterday’s oil rally was also supported by the massive fall in US inventories reported by API (American Petroleum Institute) data. The API data showed that oil stocks fell by 7.3 MMbbls (million barrels) for the week ending July 10, 2015. Industry surveys projected a fall in crude oil stocks by 2.067 MMbbls over the same period.
This is the fifth up day for oil prices in the last ten trading sessions. Prices fell by 0.93% more on the average down days than on the average up days, in the last ten days. WTI oil futures for August delivery fared well against all of the other commodities in yesterday’s trade. Prices rose more than 1% YTD (year-to-date)—led by falling US oil stocks.
The rising oil prices benefit oil producers like Chevron (CVX), ExxonMobil (XOM), and EOG Resources (EOG). They account for 31.49% of the Energy Select Sector SPDR ETF (XLE). These stocks have a crude oil production mix that’s greater than 41% of their total production.
