An Overview of Sunoco Logistics Partners
Sunoco Logistics Partners (SXL) is an energy midstream master limited partnership. It operates crude oil, natural gas, refined products, and natural gas liquids pipeline and terminal assets.
March 24 2015, Published 11:41 a.m. ET

A snapshot of Sunoco Logistics Partners
Sunoco Logistics Partners (SXL) is an energy midstream master limited partnership. Sunoco Logistics owns and operates crude oil, natural gas, refined products, and natural gas liquids (or NGLs) pipeline and terminal assets. The company also purchases and sells energy commodities through acquisition and marketing assets. This article will provide a key overview of Sunoco Logistics.
A brief history of the company
Following the acquisition by Energy Transfer Partners (ETP) in October 2012, Sunoco Logistics (SXL) became ETP’s subsidiary. A subsidiary of ETP now serves as SXL’s general partner.
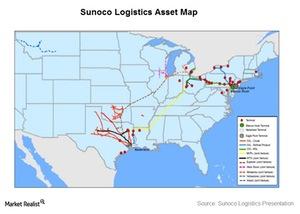
Sunoco Logistics (SXL) operates in 35 states in the US. The company operates through four segments:
- crude oil pipelines
- crude oil acquisition and marketing
- terminal facilities
- products pipelines
One year unit price
Sunoco Logistics is an MLP, so it offers common units equivalent of common shares to its unit holders.
Sunoco Logistics’ (SXL) unit price decreased 2% in the past year. Its stock dipped in October 2014 and January, when unit price declined 25% from its high recorded in September 2014. Its price has recovered partially to ~$41 per share this month.
In comparison, Energy Transfer Partners’ (ETP) unit price increased ~2% in the past year, while Boardwalk Pipeline Partners’ (BWP) unit price increased 32%. During the same timeframe, ONEOK Partners’ (OKS) unit price decreased 22%. OKS accounts for 0.6% of the iShares US Energy ETF (IYE).
Sunoco units are up for sale
In March, Sunoco Logistics (SXL) announced the sale of its 13.5 million common units priced at $41.76 per unit.
In the next section of this series, we’ll discuss each of the company’s segments and the key factors that drive business, starting with the crude oil pipeline segment.
