Why GDP and automotive industry growth are related
There’s a direct correlation between the size of a country’s GDP and its automotive industry. The auto industry has been expanding at a fast pace over the past several years.
Feb. 13 2015, Updated 3:06 p.m. ET

Economic connection
There’s a direct correlation between the size of a country’s gross domestic product, or GDP, and its automotive industry. GDP accounts for the consumption, investments, net exports, and government spending during a given time period.
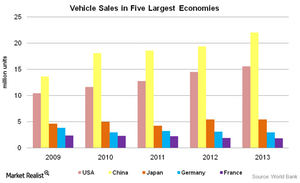
The above graph shows the number of vehicles sold in the five largest economies in the world. In 2013, four out of the five nations also had the world’s biggest automotive markets in terms of units sold. The only outsider is Brazil. It sold 3.58 million units that year. Brazil even came out ahead of Germany. Germany sold 2.95 million vehicles.
Major industry growth
Except for 2012, when growth was slow or negative, the auto industry has been expanding at a fast pace over the past several years.
The above graph shows the vehicle production rates for the fastest-growing countries with GDP thresholds of more than $750 billion as of 2013.
Between 2009 and 2013, China’s automotive industry had a compound annual growth rate, or CAGR, of 18.6%. The CAGR for India’s auto industry was 16.3%. Indonesia wasn’t far behind. It had an auto industry CAGR of 15.1%.
High-growth economies require better means of transportation and faster mobility. So, more vehicles are made and sold. This attracts more investment. The auto industry benefits from the cycle.
Car manufacturers—like Honda (HMC), Toyota (TM), General Motors (GM), and Ford (F)—experienced high growth in Asia during the economic slowdown in the West. These companies are part of the First Trust NASDAQ Global Auto ETF (CARZ).
In the next part of this series, we’ll discuss how business conditions affect the auto manufacturing sector.
