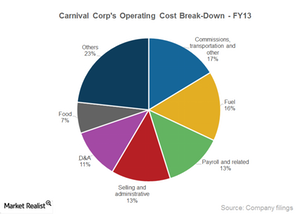
A key overview of Carnival’s costs and profitability
Carnival’s operating profit increased to $1,792 million in 2014, from $1,352 million in 2013. Its operating margin increased to 11.3%, from 8.7% in 2013.
Jan. 16 2015, Updated 8:37 a.m. ET

Carnival’s profits increase with growth in demand
We’ve seen how Carnival Corporation’s (CCL) top line increased primarily due to growth in demand. This combined with a decrease in costs has resulted in higher profitability. Carnival Corporation’s operating profit increased to $1,792 million in 2014, from $1,352 million in 2013. The company’s operating margin increased to 11.3%, from 8.7% in 2013.
In 2013, Carnival’s Corporation’s operating profit was lower than its peers. Royal Caribbean Cruises’ (RCL) operating margin was 10%, and Norwegian Cruise Line Holdings’ (NCLH) was even higher at 15.4%. However, Carnival’s net margin was 7%, which was higher than Royal Caribbean’s at 6% and Norwegian’s at 4%.
Higher profitability of cruise lines has positively impacted the performance of ETFs such as the PowerShares Dynamic Leisure and Entertainment Portfolio (PEJ), the PowerShares Dynamic Large Cap Growth Portfolio (PWB), and the Consumer Discretionary Select Sector SPDR Fund (XLY).
What are the components of Carnival’s operating costs?
Let’s look now at the components of Carnival Corporation’s (CCL) operating costs.
- Cost of passenger cruise bookings. This includes travel agent commissions, air- and other transportation-related costs, government fees, and taxes. Passenger bookings accounted for ~16% of Carnival’s total operating cost in 2014.
- Cost of fuel, including fuel delivery. This is Carnival’s next largest cost component. It comprises ~14% of the total cost. Payroll and related costs include costs for deck and engine crews, officers, and hotel and administrative employees. This was ~14% of the total cost in 2014.
- Other major ship operating expenses. These include port costs, repairs and maintenance, hotel and entertainment, insurance premiums, and gains and losses on ship sales. This component doesn’t include selling and administrative expenses, D&A (depreciation and amortization), and food. Onboard and other cruise costs include the cost of liquor and some nonalcoholic beverages, goods sold onboard, and precruise and postcruise land packages.
In the next article, we’ll learn more in detail about the trend in unit cost growth and what’s been the primary contributor to increased margins.
