Key metrics to measure Royal Caribbean’s revenue performance
Now let’s look at certain key operating metrics used in the cruising industry to evaluate operational performance.
Nov. 20 2019, Updated 2:47 p.m. ET

Revenue drivers
Now let’s look at certain key operating metrics used in the cruising industry to evaluate operational performance. This includes the following revenue cost drivers.
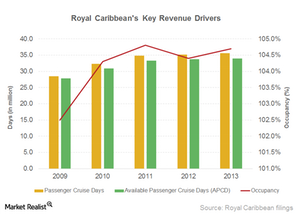
Passenger cruise days are calculated as the number of passengers carried for the period multiplied by the number of days of the respective cruises. Royal Caribbean (RCL) has managed to increase its passenger count at a compound annual growth rate or CAGR of ~5.3% and its passenger cruise days at a CAGR of 5.7% since 2009. Average cruise days have remained between seven days and 7.3 days during this period, while increasing demand for cruise vacations and the company’s loyalty programs have been instrumental in increasing its passenger count.
Available passenger cruise days (or APCD) are a measure of capacity. They represent double occupancy per cabin multiplied by the number of cruise days for the period. APCD is used to calculate unit revenue, unit cost, and occupancy. Royal Caribbean’s capacity also increased at a CAGR of ~5% since 2009.
Occupancy is calculated by dividing passenger cruise days by APCD. A percentage above 100% indicates that more than two passengers occupied some cabins. An increase in occupancy rates is positive for the company, as it results in higher revenue for a marginally higher cost and thereby improves margins. Margin improvements have a positive impact on ETFs such as the PowerShares Dynamic Leisure and Entertainment Portfolio (PEJ), which hold shares of the three major cruise operators. Royal Caribbean’s (RCL) occupancy rates has been increasing. However, in 2013, Royal Caribbean’s occupancy was 104.7%—lower than Carnival Corporation’s (CCL) 105.1% and Norwegian Cruise’s (NCLH) 109%.
