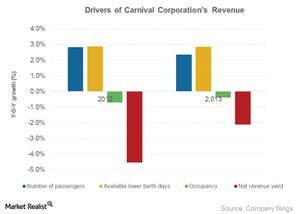
Key drivers of Carnival’s revenue growth
The growth of demand was the key driver of Carnival Corporation’s revenue growth in 2014. The number of passengers increased by 5% in 2014.
Jan. 15 2015, Updated 2:37 p.m. ET

Cruise line revenue growth
Cruise line revenue growth is supported by growth in passenger numbers, capacity, occupancy, and yield. Carnival Corporation’s (CCL) revenue has increased over the last three years to $15,884 million in 2014 from $15,382 million in 2012.
In 2013, Carnival Corporation’s revenue growth was 0.5% lower than its peers. Royal Caribbean Cruises Ltd. (RCL) posted a 3.5% growth. Norwegian Cruise Line Holdings Ltd. (NCLH) recorded the highest revenue growth of ~13%.
The growth of demand was the key driver of Carnival Corporation’s revenue growth in 2014. The number of passengers increased by 5% in 2014. Demand for cruises is seasonal and generally higher during the summer months, which corresponds with the company’s third quarter. During the quarter, Carnival’s ticket revenue and occupancy levels were the highest.
How to measure revenue performance in the cruise industry
Let’s look at the two important metrics used to measure revenue performance in the cruise industry.
- Average Lower Berth Days (or ALBDs). This is a standard measure of passenger capacity. It’s calculated by multiplying passenger capacity by the revenue-producing ship’s operating days in the period. ALBD assumes that each cabin that’s offered for sale accommodates two passengers. The same assumption is used for the calculation of occupancy rate. Occupancy of more than 100% indicates that on average more than two passengers occupied some cabins. In 2014, Carnival Corporation’s ALBD increased year-over-year by 2.7%, but occupancy decreased to 104.1% from 105.1% in 2013.
- Net revenue yield. This is an important metric used in the cruise industry to measure a company’s revenue performance. It’s also used for revenue management purposes. It’s calculated as net cruise revenue divided by ALBD. Net cruise revenue, after deducting variable cost such as travel agent commission, cost of air transportation, and certain other variable costs related to onboard and other services from gross revenue, is considered more appropriate to measure performance. Carnival Corporation’s net revenue yield picked up slightly in 2014 with a year-over-year growth of 0.9% to $169.1 after decreasing for two consecutive years.
Growth in demand for cruises has positively impacted shares of cruise liners and ETFs such as the PowerShares Dynamic Leisure and Entertainment Portfolio (PEJ), the PowerShares Dynamic Large Cap Growth Portfolio (PWB), and the Consumer Discretionary Select Sector SPDR Fund (XLY). These funds hold shares of the three major cruise lines.
