When The Net Asset Value Of A Bond ETF Differs From Market Price
The Intraday Indicative Value gives us a more real-time value than the bond ETF’s NAV. It’s considered an implied value of an ETF.
Nov. 20 2020, Updated 12:42 p.m. ET

A bond ETF’s NAV is the best estimate of that fund’s underlying value, it’s still just an estimate – especially for bonds. It’s not an actionable price that investors can use to transact a portfolio of underlying securities. The reality is that market price of a bond ETF represents the price at which the underlying bonds can actually be traded at any given moment. Often when we talk about how innovative bond ETFs are, this is what we’re referring to – the bond market simply didn’t have this kind of price transparency before bond ETFs came along.
Market Realist – Bond ETF’s NAV and its market prices may differ from time to time 
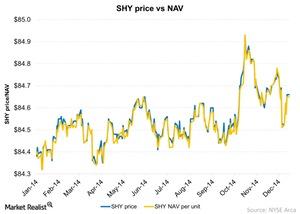
The above graph compares prices for the iShares 1-3 Year Treasury Bond ETF (SHY) with its NAV (net asset value). As you can see, the NAV and the price are almost the same. The price of the ETF is the price at which the underlying bonds can be bought and sold.
NAVs are calculated at the end of the day. Meanwhile, there is a metric known as the Intraday Indicative Value, or IIV, which gives us a more real-time value than the bond ETF’s NAV. The IIV is considered an implied value of an ETF and is calculated using the recent prices of the securities in the basket.
Some of the largest bond ETFs in terms of volume are the iShares Barclays 20+ Year Treasury Bond ETF (TLT), the SPDR Barclays Capital High Yield Bond ETF (JNK), and the iShares iBoxx $ High Yield Corporate Bond ETF (HYG). You can also access emerging market bonds with the iShares J.P. Morgan USD Emerging Markets Bond ETF (EMB).
Read Market Realist’s series, Your core portfolio: How to choose the right ETFs, for more on ETFs.
