Understanding The Doji Candlestick Pattern In Technical Analysis
The Doji candlestick pattern has a single candle. In this pattern, the stock opening and closing prices are equal. The pattern forms due to indecision between the buyers and sellers in the stock market.
Nov. 27 2019, Updated 7:25 p.m. ET

Doji candlestick pattern
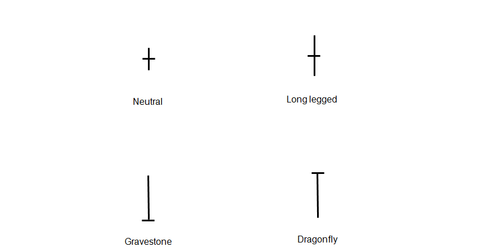
The Doji candlestick pattern has a single candle. In this pattern, the stock opening and closing prices are equal. The candlestick pattern forms due to indecision between the buyers and sellers in the stock market. It’s one of the most common candlestick patterns. There are four types of Doji candlestick patterns:
- Neutral Doji
- Long-Legged Doji
- Gravestone Doji
- Dragonfly Doji
Neutral Doji
A Neutral Doji is a small candlestick pattern. The stock open and close at the middle of the day’s high and low. This pattern forms when buying and selling activity is at equilibrium. The prior trend and the Doji pattern determine the trend’s future direction.
Long-Legged Doji
A Long-Legged Doji is a long candlestick pattern. The stock open and close at the middle of the day’s high and low. This pattern forms when supply and demand forces are at equilibrium. The prior trend and the Doji pattern determine the trend’s future direction.
Gravestone Doji
In the Gravestone Doji pattern, the stock open and close at the day’s low. This pattern forms at the bottom of a downtrend. It forms when supply and demand forces are at equilibrium. The prior trend and the Doji pattern determine the trend’s future direction.
Dragonfly Doji
In the Dragonfly Doji, the stock open and close at the day’s high. This pattern forms at the peak of an uptrend. It forms when the supply and demand forces are at equilibrium.
The Doji patterns are used to identify trends. The patterns are used as entry and exit points. When the Doji pattern forms at the support level, it can be used as an entry point. When the Doji pattern forms at a resistance level, it can be used as an exit point. It’s advisable to use a combination of patterns and indicators to determine your trading strategy.
Key stocks with these candlestick patterns
Recently, we’ve seen a Neutral Doji pattern in Cambium Learning Group (ABCD), Atlas Financial Holdings (AFH), and Ann Inc. (ANN). In contrast, AAON Inc. (AAON) is showing a Dragonfly Doji pattern. Alon USA Energy (ALJ) is showing a Long-Legged Doji pattern. The Long-Legged Doji is also seen in the SPDR S&P 500 (SPY).
