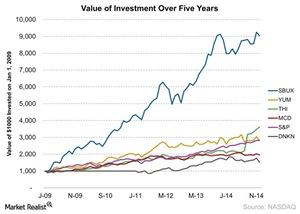
Starbucks’ 5-Year Stock Performance
Now, we’ll discuss SBUX’s stock performance over the past few years. SBUX returned $9,037 on $1,000 invested on January 1, 2009. The fourth quarter earnings announcement is approaching.
Dec. 31 2014, Updated 2:39 p.m. ET

SBUX’s stock performance
In this series, we discussed Starbucks’ (SBUX) same-store sales growth, marketing expenses, unit growth, key operating costs, and profitability. Now, we’ll discuss SBUX’s stock performance over the past few years.
In the above chart, you can see that SBUX returned $9,037 on $1,000 invested on January 1, 2009. Tim Hortons (THI) had a return of $3,611. McDonald’s (MCD) invested the same amount. It returned $1,951. Yum! Brands (YUM) operates Kentucky Fried Chicken, or KFC, Pizza Hut, and Taco Bell. It returned $2,798.
Over the five-year period, an investment in the S&P 500 Index—represented by the SPDR S&P 500 ETF (SPY)—returned $2,823.
Dunkin’ Brands (DNKN) returned $1,525. However, this was an investment as of June 2011 when DNKN was listed on the stock exchange.
Wall Street analysts’ estimates
The fourth quarter earnings announcement is approaching. It’s expected to be released on January 1, 2015. Below are the estimates for the first quarter.
- Adjusted earnings per share, or EPS, is estimated at $0.79
- Sales are expected to come in at $4.7 billion
- Operating profit is estimated at $923 million
- Net profit is estimated at $608 million
As of December 24, the consensus price target for SBUX was $90. This is an upside of 11% from the market price of $81.43.
Latest earnings overview
TXRH announced its third quarter earnings on November 3, 2014. Let’s look at how the company has performed of late in the next part of this series.
