Why Lululemon’s Profit Margins Are Trumping The Company’s Peers’
LULU’s gross profit margin slipped from 55.7% in fiscal 2013 to 52.8% in fiscal 2014. The company’s operating profit margin slipped from 27.5% to 24.6%.
Nov. 27 2019, Updated 7:22 p.m. ET

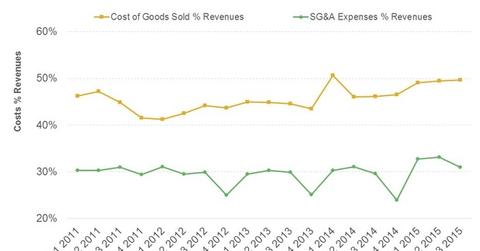
Analyzing Lululemon’s cost structure
As we mentioned earlier in this series, most of Lululemon Athletica’s (LULU) products are manufactured overseas. This is typical of apparel retailers (XRT), as this approach gives companies cost advantages. It also leaves companies vulnerable to macroeconomic factors affecting other companies and currency headwinds.
Recent cost-side headwinds
In recent quarters, costs have risen for LULU, driven by:
- the depreciating Canadian and Australian dollars
- an increase in the cost of inputs used in manufacturing, particularly print fabrics
- higher occupancy costs
- higher investment in design and production
- higher wages, salaries, and management incentives
- higher operating costs due to accelerated store rollouts and e-commerce initiatives
- inventory markdowns due to product recalls in 2013.
These factors have resulted in a drop in the company’s profit margins. LULU’s gross profit margin slipped from 55.7% in fiscal 2013 to 52.8% in fiscal 2014. The company’s operating profit margin also posted a decline, slipping from 27.5% to 24.6% over the same period.
Peer group comparison
That said, LULU is still more profitable than its peers, as the graph above indicates. A lot of this advantage has to do with the company’s retail-oriented model, compared to other athletic goods sellers like NIKE (NKE), Under Armour (UA), Adidas (ADDYY), and VF Corporation (VFC). LULU’s sales through the wholesale channel are very marginal. Most of its products (~95%) sell either through its own retail outlets or through its websites and phone sales (refer to Parts 6 and 7 of this series). Wholesale channel sales make up a much larger revenue chunk for LULU’s rivals:
- ~68% in 2013 for Under Armour (UA)
- ~79% in fiscal 2014 for NIKE (NKE)
- ~77% in fiscal 2013 for VF Corporation (VFC)
Sales through the wholesale channel typically earn lower margins, which benefits profitability. However, although margins are still high, they’ve been under pressure lately. Read about the causes and how LULU’s looking to revitalize its margins in the next article in this series.
