An investor’s guide to Ford Motor Company: Revenue and key drivers
Ford is behind the industry trends with its 2013 units’ sales. Ford’s units in Latin America are roughly in line with industry sales at 8%.
May 19 2014, Published 5:44 p.m. ET

Ford’s industry sales
We’ll take a brief look at the industry sales to assess Ford Motor Company’s (F) position in the global industry. First it’s the industry sales and secondly it’s Ford’s ability to capture its share of the market. As we’ve seen, the top industry players are Toyota Motor Corporation (TM), General Motors (GM), Volkswagen (VOW), and the BMW Group (BMW). The exchange-traded fund providing industry exposure is CARZ. As we see from the pie chart in the first part of this series, Ford is the sixth largest global auto manufacturer behind TM, VOW, GM, Hyndai-Kia Group, and Renault-Nissan Group. This is in terms of global units sold in 2013. The next important aspect is where Ford is selling its vehicles.
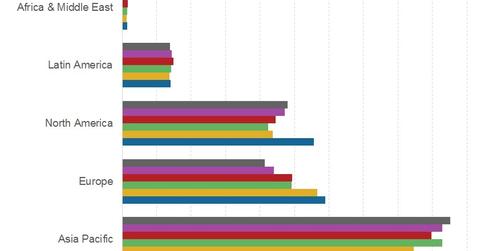
The chart above shows the regional changes in the automobile industry over the past five years. The big take-away from this chart is the explosion of the Asia Pacific market from 20 million units in 2009, to 36 million units in 2013, driven by market demand in China. This offset the decline in Europe and the lower growth from North America. Latin America remains a small, but significant market.
Ford is behind the industry trends with its 2013 units’ sales. Ford’s units sold are 49% in North America versus less than 25% in the global market. Ford’s units sold are close to industry percentages with 20% of 2013 sales in Europe. Ford is behind in Asia Pacific where the industry is nearly 45% of the market, but only 21% of Ford’s 2013 units sold are in Asia. Ford’s units in Latin America are roughly in line with industry sales at 8%. Ford is addressing this by opening six new facilities in China and India in the next two years. It’s a huge investment for Ford.
Where Ford’s position is important is that it’s under-represented where the industry growth is. It relies on the growth in the U.S. market to drive sales. While this works out sometimes, it’s less diversified than it could be. As shown in the chart above, Asia Pacific grew by 7% in the first quarter of 2014 versus the first quarter of 2013. If Ford was more aligned with the industry, it would have captured more of this growth. Next, we’ll look why market share matters.
