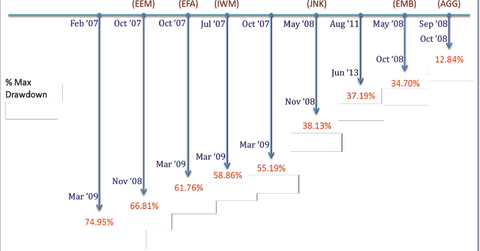
Must-know: Minimizing ETF losses by observing max drawdowns
In practice, asset owners (both retail and institutional) want to avoid significant portfolio drawdowns even if the benchmark index declines.
Nov. 22 2019, Updated 5:10 a.m. ET

Loss minimization
In theory, asset managers are evaluated against index benchmarks by their asset owner clients. In practice, asset owners (both retail and institutional) want to avoid significant portfolio drawdowns even if the benchmark index declines. It’s therefore useful to look both at the magnitude of max drawdowns for key ETFs over the last ten years and at whether these drawdown periods coincided.
This chart shows the max drawdown for widely used ETFs in the trailing ten years* with peak and trough dates. Max drawdown is the largest percentage drop from a peak to a bottom at any time during the measurement period.
Note: This data os for the ten-year period from November 30, 2003, to November 29, 2013.
* Since GLD, EMB, and JNK have traded for less than ten years, max drawdown is for the period since their inception.
It’s interesting to note the significant overlap between the periods when all the equity ETFs experienced their max drawdowns despite the varying market cap range and geography exposure. In contrast, gold (GLD) experienced its max drawdown only in the 2011–2013 period, once investors had regained their appetite for equity risk. Of course, this doesn’t imply that GLD didn’t decline at all in 2007–2009 or that there’s no correlation between these asset classes.
In the chart below, we show the max drawdown metrics and peak-trough dates for the nine Select Sector SPDRs over the same trailing ten-year period.
Note: This data is for the ten-year period from November 30, 2003, to November 29, 2013.
Since all the sector SPDRs are subsets of SPY (the S&P 500), it’s reasonable to assume there would be a high degree of overlap in their max drawdown periods. It is, however, interesting to note the significant variation in the max drawdown values. As you would expect, the Consumer Staples Sector ETF (XLP) shows the least max drawdown and also has less overlap in its max drawdown period than the other sector SPDRs.
