2 key things that set the floor and ceiling for urea prices
Without an understanding of factors that affect crop prices, it would be difficult to formulate a view on future crop prices and demand for nitrogenous fertilizers.
Nov. 20 2020, Updated 1:30 p.m. ET

Urea margin over ammonia
The previous part of this series showed that from 2004 to 2011, the average demand-driven margin for urea was approximately $75 per ton. Investors should note that in a demand-driven market, urea tends to command a margin over ammonia since ammonia can’t be easily transported and people are willing to pay more.
Ammonia sets the price floor
Because urea is produced out of ammonia, ammonia sets the price floor for urea. If urea price drops below the floor, more ammonia will be offered and less urea will be sold. But in a demand-driven market, not every nitrogenous fertilizer producer has the capacity to produce urea. So a premium is attached to urea products.
Grain sets the ceiling for urea
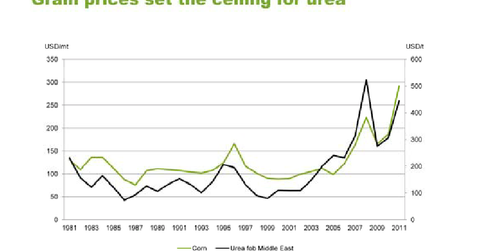
What sets the ceiling price of urea, though, depends on grain prices. According to Yara International, changes in grain prices (corn or wheat) explain about 50% of movements in urea price. The chart above shows a relatively strong relationship between the two. When corn prices rise, urea prices tend to rise, and when corn prices fall, so do urea prices. Part of this is due to changes in demand for fertilizers as farmers make decisions to plant how many acres of crops next year. The other part is due to sentiment, prosperity, prospects, and expectations—which we mentioned in the previous article.
Correlation and causation
While long-term grain prices have shown a strong correlation with fertilizer prices, it’s important to know that correlation does not imply causation. Crop prices themselves are affected by factors like the U.S. dollar, economic growth in emerging markets (which plays an important role in individuals’ disposable income and demand for food), and weather. Without an understanding of factors that affect crop prices, it would be difficult to formulate a view on future crop prices and demand for nitrogenous fertilizers.
A few of these indicators can be found at Market Realist’s Industry Pages.
