Shipping stocks rise as Capesize rates approach $20,000
From August 23 to 30, shipping rates for Panamax, Supramax, and Capesize vessels stood relatively unchanged.
Nov. 20 2020, Updated 4:55 p.m. ET

Supply and demand drives dry bulk shipping companies
Unlike imports data that aren’t widely available on a weekly basis, shipping rates (which reflect the difference in supply and demand) are collected daily at the London-based Baltic Exchange and published as the BDI (Baltic Dry Indexes). These indexes reflect the daily shipping rates to transport key dry bulk raw materials in the spot market. When demand outpaces supply growth, shipping rates tend to rise. But when an increase in supply doesn’t meet with demand, shipping rates fall. [1. The two main revenue generation models in the shipping industry are spot (voyage) and time (period) charters. “Spot charters” refer to the one-time price of shipping a specific amount of raw material, while “time charters” reflect the price of borrowing a ship’s service for a specific period. “Time Charter Equivalent” (TCE), which converts spot charters (specified in $ per ton) to time charter rates ($ per day), is often used to compare companies in different markets. The two often mirror each other over the medium and long terms.]
Capesize continues to outperform
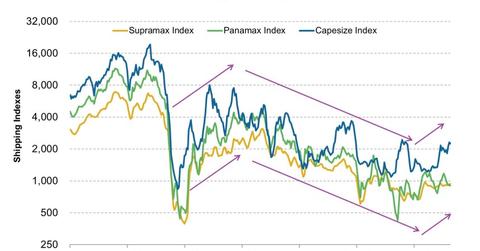
From August 23 to 30, shipping rates for Panamax, Supramax, and Capesize vessels stood relatively unchanged. The Panamax BDI index improved slightly, from 903 to 907, and the Supramax BDI Index saw a larger increase, from 927 to 939, that was supported by some scrapping activity. Capesize rates pulled back a bit from their recent non-stop rise, declining from 2,312 to 2,243. On September 5, 2013, the index rose further to 2,660 for Capesize, 961 for Panamax, and 952 for Supramax vessels. Capesize time charter rates are closing up to $20,000 a day. If they break above $20,000, which could happen later this year, they would take out 2012 highs.
Capesize vessels, which carry primarily iron ores and coals, have risen lately on the back of higher ion ore shipments. While Panamax vessels also carry iron ore, these vessels are smaller and are also used for other dry bulks like grain. The unsustainable increase in Panamax rates shows capacity growth continues to negatively affect supply and demand dynamics.
Past patterns, support, and upsides
Historically, rates for Capesize vessels have risen during the second half of the year, as Australian and Brazilian shipments grew. This year, we’ll likely see a similar development as new mining capacity comes online. Higher shipments would mean less incentive for companies to scrap or delay vessels—unlike last year, when the Capesize index fell to just above 1,200. That could limit upside potential in Capesize rates, but it primarily suggests rates are improving. If rates were to fall back to just 1,200, companies would likely delay extra new deliveries and scrap old vessels again, which would support shipping rates.
Outlook for shipping rates and implication
Investors can look forward to higher Capesize rates during the second half of this year compared to the first half, which is positive for dry bulk shippers like DryShips Inc. (DRYS), Navios Maritime Partners LP (NMM), Diana Shipping Inc. (DSX), Safe Bulkers Inc. (SB), and Navios Maritime Holdings Inc. (NM), which all carry Capesize vessels. If rates do fall, they would present a long-term opportunity, since rates are turning around, and they would suggest that investors shouldn’t get spooked. As there are some overlaps in the kinds of dry bulks each vessel carries, higher Capesize rates will also support Panamax vessels, and to a minor extent Supramax vessels too.
For other interesting indicators, please visit our Marine Shipping page. We also recommend two additional indicators published last week, starting with forward contracts, where you’ll see the second indicator as well.
Disclosure: I own shares in Diana Shipping Inc.
