Key Technical Levels in Ford Stock before Its 1Q17 Earnings
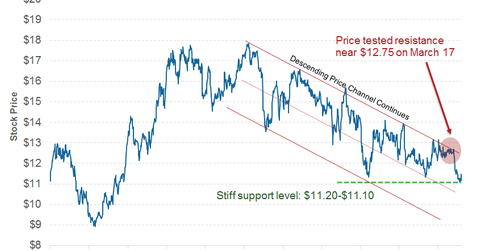
On March 17, Ford stock tested the upper range of the descending channel near $12.75. It couldn’t close above the level and turned negative.
Nov. 20 2020, Updated 1:11 p.m. ET

Ford stock
As of April 19, 2017, Ford (F) stock was trading at $11.19. The company’s stock price has been moving in a downward sloping channel for more than a few years, which is also known as a “descending price channel.” Its downward price movement reflects weakening underlying momentum.
Key support and resistance levels
On March 17, Ford stock tested the upper range of the descending channel near $12.75. It couldn’t close above the level and turned negative. Therefore, the swing high near $12.75 should continue to act as a key resistance level. An immediate resistance lies near $12.10.
On the downside, the price should face stiff support near $11.10. Upward stock price movements might see resistance near the resistance levels. Downward price movements might hit a roadblock around support levels.
Read A Must-Read Guide to Ford Motor Company, an Auto Industry Pioneer to learn about Ford’s business and financials.
US auto industry’s 1Q17 earnings
The US auto industry’s (XLY) 1Q17 earnings season already started with Harley-Davidson (HOG). The company reported its dismal 1Q earnings results on April 18. Read Harley-Davidson’s 1Q17 Results: Tough Times Ahead? to learn more.
Ford’s direct US peers such as General Motors (GM) and Fiat Chrysler (FCAU) are also set to release their 1Q17 earnings results in the last week of April.
Auto investors can stay updated about analysts’ estimates by visiting Market Realist’s Autos page.
