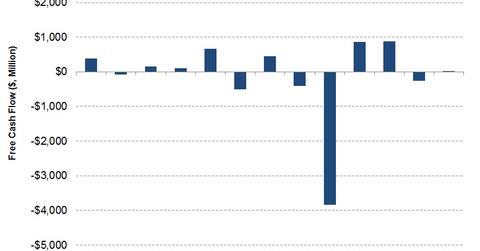
How Halliburton’s Free Cash Flow Turned Around in 2Q17
Halliburton’s (HAL) cash from operating activities (or CFO) in 2Q17 was a huge improvement over 2Q16 as well as an increase over 1Q17.
Nov. 20 2020, Updated 2:31 p.m. ET

Halliburton’s operating cash flows
Halliburton’s (HAL) cash from operating activities (or CFO) in 2Q17 was a huge improvement over 2Q16 as well as an increase over 1Q17. HAL’s CFO was $346 million in 2Q17, a change from -$3.6 billion CFO in 2Q16.
In 2Q16, HAL’s CFO was reduced by a $3.5 billion termination fee paid to Baker Hughes during the quarter. Halliburton is 2.2% of the iShares North American Natural Resources ETF (IGE). Since June 30, 2017, HAL fell 9% compared to a 2% decline in IGE’s price.
Why did HAL’s cash flows increase?
Increased drilling activity in North America, Latin America, North Sea, and Russia, higher pressure pumping asset utilization, and better pricing in the US onshore business led to increased cash flows for Halliburton in 2Q17.
Halliburton’s free cash flow
HAL’s capital expenditure (or capex) rose 54% from 2Q16 to 2Q17. Despite higher capex, a sharp rise in CFO led to positive free cash flow (or FCF) in 2Q17. In 2Q17, HAL’s FCF turned to $19 million, compared to -$3.8 billion FCF a year ago. Halliburton’s FCF has been negative in six out of the past 13 quarters. Read more on Halliburton in Market Realist’s Why Is Halliburton Buoyant after Its 2Q17 Earnings?
Free cash flow for HAL’s peers
Schlumberger’s (SLB) FCF was $355 million in 2Q17. Oceaneering International’s (OII) 2Q17 FCF was $30 million.
Halliburton’s capex plans
Halliburton has been reactivating cold-stacked pressure pumping equipment to meet increased demand from the upstream industry. HAL plans to convert its hydraulic fracturing fleet to Q10 pumps to support its surface efficiency model.
Next, we’ll discuss Fairmount Santrol Holdings’ (FMSA) free cash flow.
