Why American Airlines Improved Its Unit Revenue Guidance for 2Q17
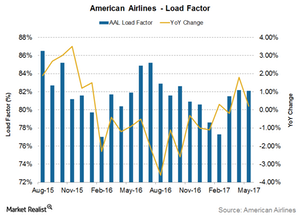
AAL’s utilization rose 0.3% YoY (year-over-year) in February, then by 1.8% YoY in April and 0.2% YoY in May.
June 13 2017, Updated 10:37 a.m. ET

Load factor
An airline’s utilization is based on supply and demand factors. As American Airlines’ (AAL) capacity growth outpaced its traffic growth throughout 2016, its utilization was in a declining trend throughout that year. However, as traffic growth has outpaced capacity growth in 2017 (in three of the five months), AAL’s utilizations have also improved overall.
AAL’s utilization rose 0.3% YoY (year-over-year) in February, then by 1.8% YoY in April and 0.2% YoY in May. American’s load factor has risen 0.3% YoY to 80.2% as of May.
Yields improve
Improving utilizations supported by declining fuel costs have helped the airline improve its yields. For the first quarter of 2017, AAL’s yields improved by 2.4% YoY to $0.16. This led to a 3.1% YoY improvement in unit revenues for the quarter.
American Airlines improves guidance
In its investor update on April 27, 2017, AAL projected that its total revenue per available seat mile would grow 3%–5% in 2Q17. The company now expects its unit revenues in 2Q17 to see growth of 3.5%–5.5% YoY. Its operating margins are also expected to improve to 12%–14%, as compared to its earlier guidance of 11%–13%.
Notably, peers United Continental (UAL), Southwest Airlines (LUV), and Delta Air Lines (DAL) have a similar outlook. Investors can gain exposure to AAL by investing in the PowerShares Dynamic Large Cap Value Portfolio (PWV), which has 1.5% of its total portfolio in AAL.
