What Nabors Industries’ Historical Valuation Suggests
On March 31, 2017, Nabors Industries (NBR) stock was 20.0% lower than it was on December 30, 2016. In 1Q17, NBR’s adjusted earnings were negative.
Nov. 20 2020, Updated 3:09 p.m. ET

PE trend
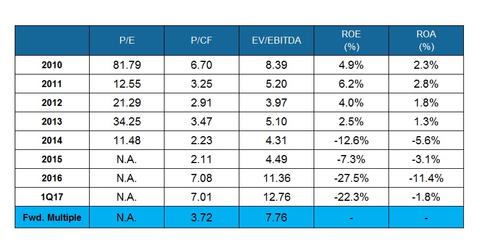
Nabors Industries’ forward PE also isn’t meaningful, reflecting analysts’ expectation of negative earnings for the next four quarters.
Price-to-cash-flow multiple
Nabors Industries’ forward PCF (price-to-cash-flow) multiple is lower than it was in 1Q17. That reflects analysts’ expectations of higher cash flows in the next four quarters.
EV-to-EBITDA trend
In 1Q17, NBR’s enterprise value (or EV) fell over 4Q16, primarily as a result of NBR stock falling during the same period. Although NBR’s adjusted EBITDA (earnings before interest, tax, depreciation, and amortization) also fell in the same period, it couldn’t offset the fall in the stock. In effect, the EV-to-EBITDA multiple rose in 1Q17 compared to 2016. In 1Q17, NBR’s historical valuation, expressed as an EV-to-EBITDA multiple, was higher than its past eight-year average.
Nabors Industries’ forward EV-to-EBITDA multiple is lower than 1Q17, reflecting analysts’ expectations of a higher adjusted EBITDA in the next four quarters. That typically reflects in a higher current EV-to-EBITDA multiple compared to the historical average.
EV-to-EBITDA multiple for NBR’s peers
Schlumberger’s (SLB) forward EV-to-EBITDA multiple is 12.9x, National Oilwell Varco’s (NOV) is 16.7x, and Patterson-UTI Energy’s (PTEN) is 7.3x. You can read more on NOV’s valuation in Market Realist’s National Oilwell Varco: Wall Street’s Rating and Valuation.
Next, let’s take a look at Nabors Industries’ valuation compared to its industry peers.
