Analyzing Halliburton’s Free Cash Flow and Capex Plans
Halliburton’s cash from operating activities (or CFO) in 1Q17 was an improvement over 1Q16, although it was a steep deterioration compared to 4Q16.
June 15 2017, Updated 9:06 a.m. ET

Halliburton’s operating cash flows
Halliburton’s cash from operating activities (or CFO) in 1Q17 was an improvement over 1Q16, although it was a steep deterioration compared to 4Q16. HAL’s CFO was at ~$5 million in 1Q17.
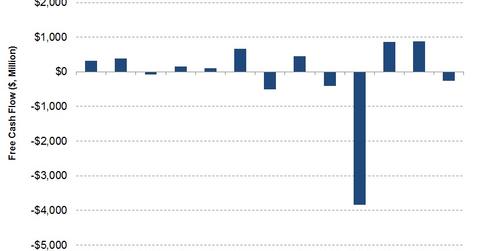
In 2Q16, HAL’s CFO was negatively affected by a $3.5 billion termination fee paid to Baker Hughes during the quarter. Halliburton makes up 2.4% of the iShares North American Natural Resources ETF (IGE). Since March 31, 2017, HAL fell 9% compared to a 6% decline in IGE’s price.
Halliburton’s free cash flow
HAL’s capital expenditure (or capex) rose 53% from 4Q16 to 1Q17. Higher capex coupled with a sharp decline in CFO led to a lower free cash flow (or FCF) in 1Q17. In 1Q17, HAL’s FCF turned to -$260 million compared to $886 million in FCF a quarter ago. Halliburton’s FCF has been negative in six out of the past 13 quarters.
Operating cash flow for HAL’s peers
TechnipFMC’s (FTI) CFO was $151 million in 1Q17. Weatherford International’s (WFT) 1Q17 CFO was -$179 million. Nabors Industries’ (NBR) CFO was -$58 million in 1Q17.
Halliburton’s capex plans
In 2017, HAL expects its capex to be allocated towards production enhancement, Sperry drilling, production solutions, wireline and perforating, and Baroid product service lines services. These plans include the conversion of its hydraulic fracturing fleet to Q10 pumps (required in shale fracturing) and reactivating cold-stacked pressure pumping equipment.
Next, we’ll discuss Halliburton’s dividends and dividend yields.
