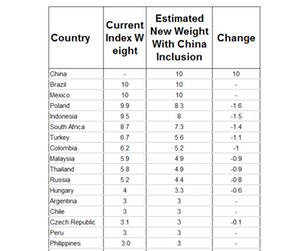
What Difference Does Index Inclusion Make?
Government bond yields in China are higher than its Asian counterparts such as South Korea and Singapore and much higher than major developed markets.
May 31 2017, Updated 10:37 a.m. ET

VanEck
Adding China Reduces EMEA2 Weighting
At current yields, China’s inclusion would bring down the overall yield on the GBI-EM Global Core Index (3.6% average yield for China versus 6.3% for current index), and would reduce duration slightly. Although the overall yield on the index would decrease at today’s yield levels, it’s worth noting that CGB yields have risen significantly since reaching their tightest levels in 2016, with the 10-year yield wider by 95 basis points through early May. Index inclusion would also boost liquidity and increase diversification given the moderate correlation of the CNY to other emerging markets currencies.
2Europe, the Middle East, and Africa.
Market Realist
Chinese government bonds offer higher yields than other markets
Government bond yields in China (EMLC) (EMAG) (IGEM) (VWOB) are higher than Asian counterparts such as South Korea and Singapore and much higher than major developed markets such as the United States, Germany, Japan, and Australia. Over a ten-year period between December 2006 and February 2016, yields on ten-year bonds remained in the range of 3.0%–5.0%. As you can see in the graph below, they are much higher than other markets, and despite the recent fall, they continue to remain the highest.
The yield peaked at 4.9% in November 2013 and recorded the lowest level of 2.5% in December 2008. Currently, the yield on ten-year Chinese bonds is hovering at around 3.7% compared to 2.2% in the United States and 0.36% in Germany. Similarly, China (PCY) (ELD) offers the higher average yield of ~5.0% on AAA-rated corporate bonds compared to 2.9% offered in other parts of Asia.
Diversification benefits
As mentioned earlier, the correlation between Chinese onshore bonds and other global bonds is very low. From 2010 to 2015, the correlation with bonds in the United States, Europe, and emerging markets ranged from 0.0 to 0.20. It was 0.13 with U.S. Treasury bonds and 0.09 with developed countries’ government bonds. The lower correlation of Chinese bonds with bonds in developed markets and emerging markets reflects a diversification advantage offered by Chinese onshore bonds (LEMB). As a result, the inclusion of China’s onshore bonds into the benchmark indexes would be beneficial to foreign investors.
