Gabelli Downgrades Johnson Controls Stock to ‘Hold’
In fiscal 2016, JCI reported net sales of $37.7 billion, a rise of 1.3% YoY (year-over-year).
Dec. 7 2016, Updated 3:35 p.m. ET

Price movement
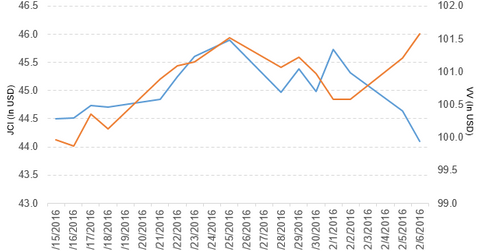
Johnson Controls (JCI) has a market cap of $41.7 billion. It fell 1.2% to close at $44.10 per share on December 6, 2016. The stock’s weekly, monthly, and year-to-date (or YTD) price movements were -2.8%, 7.9%, and 41.4%, respectively, on the same day. JCI is trading 1.3% below its 20-day moving average, 0.50% below its 50-day moving average, and 6.0% above its 200-day moving average.
Related ETF and peers
The Vanguard Large-Cap ETF (VV) invests 0.10% of its holdings in Johnson Controls. The YTD price movement of VV was 10.3% on December 6.
The market caps of Johnson Controls’ competitors are as follows:
JCI’s rating
On December 6, 2016, Gabelli downgraded Johnson Controls International’s rating to “hold” from “buy.”
Performance of Johnson Controls in fiscal 4Q16
Johnson Controls reported fiscal 4Q16 net sales of $10.2 billion, a rise of 17.2% over the net sales of $8.7 billion in fiscal 4Q15. Sales from the building efficiency and power solutions segments rose 25.2% and 7.5%, respectively, and sales from the automotive experience segment fell 5.2% between fiscal 4Q15 and fiscal 4Q16. The company’s gross profit margin expanded by 240 basis points.
The company’s net income and EPS (earnings per share) fell to -$1.2 billion and -$1.61, respectively, in fiscal 4Q16, compared with $349 million and $0.53, respectively, in fiscal 4Q15. It reported adjusted EPS of $1.21 in fiscal 4Q16.
Fiscal 2016 results
In fiscal 2016, JCI reported net sales of $37.7 billion, a rise of 1.3% YoY (year-over-year). The company’s gross margin expanded by 210 basis points in fiscal 2016. Its net income and EPS fell to -$868.0 million and -$1.30, respectively, in fiscal 2016 compared with $1.6 billion and $2.36, respectively, in fiscal 2015.
JCI’s cash and cash equivalents and inventories rose 14.6% and 49.8%, respectively, in fiscal 2016. Its current ratio and long-term debt-to-equity ratio rose to 1.04x and 0.61x, respectively, in fiscal 2016 compared with 1.00x and 0.56x in fiscal 2015.
Projections
Johnson Controls has made the following projections for fiscal 2017:
- EPS before special items in the range of $2.60 to $2.75
- organic revenue growth in the range of 2.5% to 4.5%
- EBIT (earnings before interest and taxes) margin before special items in the range of 80 basis points to 110 basis points
Now we’ll take a look at Vector Group (VGR).
