Johnson Controls Completed Its Spin-Off of Adient
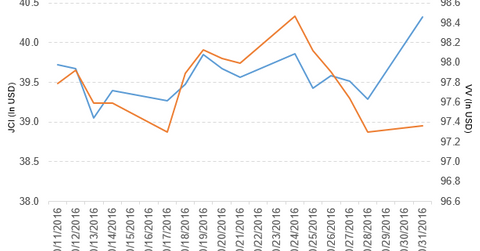
Johnson Controls fell 7.9% to close at $40.32 per share on October 31. Its weekly, monthly, and YTD price movements were -9.2%, -13.4%, and 17.9%.
Nov. 2 2016, Updated 8:07 a.m. ET

Price movement
Johnson Controls (JCI) has a market cap of $37.6 billion and fell 7.9% to close at $40.32 per share on October 31, 2016. The stock’s weekly, monthly, and YTD (year-to-date) price movements were -9.2%, -13.4%, and 17.9%, respectively, on the same day.
JCI is now trading 9.4% below its 20-day moving average, 11.9% below its 50-day moving average, and 6.8% below its 200-day moving average.
Related ETF and peers
The Vanguard Large-Cap ETF (VV) invests 0.15% of its holdings in Johnson Controls. The ETF tracks a market-cap-weighted index that covers 85% of the market capitalization of the US equity market. The YTD price movement of VV was 5.7% on October 31.
The market caps of Johnson Controls’ competitors are as follows:
Latest news on Johnson Controls
In a press release on October 31, 2016, Johnson Controls announced that its Automotive Seating business “is now Adient (ADNT), an independent, publicly traded company with 75,000 employees globally focused on strengthening its market position.”
The press release also stated: “The separation of Adient completes a process begun more than a year ago when Johnson Controls announced its plan to spin off the automotive seating business as part of its multi-industrial strategy focused on making investments in the company’s core growth platforms around buildings and energy.”
Johnson Controls’ performance in 3Q16
Johnson Controls reported 3Q16 net sales of $9.5 billion, which is a fall of 1.0%, as compared to net sales of $9.6 billion in 3Q15. Sales from its Building Efficiency and Power Solutions segments rose 33.0% and 3.1%, respectively, and sales from Automotive Experience fell 19.3% in 3Q16 YoY (year-over-year).
The company’s gross profit margin rose 12.9% YoY, and its income from continuing operations before income taxes fell 11.0% YoY in 3Q16.
Net income, EPS, and cash
The company’s net income and EPS (earnings per share) rose to $383 million and $0.59, respectively, in 3Q16, as compared to $178 million and $0.27, respectively, in 3Q15.
JCI’s cash and cash equivalents fell 21.8%, and its inventories rose 25.0% in 3Q16, as compared to 4Q15. Its current ratio and long-term debt-to-equity ratio fell to 0.92x and 0.54x, respectively, in 3Q16, as compared to 1.0x and 0.55x, respectively, in 4Q15.
Projections
The company has made the following projections:
- It expects the EPS in the range of $3.95–$3.98 per share for fiscal 2016, which reflects strong operational performance.
- It expects EPS in the range of $1.17–$1.20 for fiscal 4Q16.
This guidance does not include the impact of the Tyco merger and transaction, integration, and separation costs, year-end pension and post-retirement mark-to-market adjustments, and other non-recurring items.
Now let’s move to Procter & Gamble (PG).
