Why Is Newell Brands Selling Its Tool Business?
Newell Brands reported 2Q16 net sales of $3.9 billion—a rise of 143.8% compared to net sales of $1.6 billion in 2Q15.
Nov. 20 2020, Updated 3:12 p.m. ET

Price movement
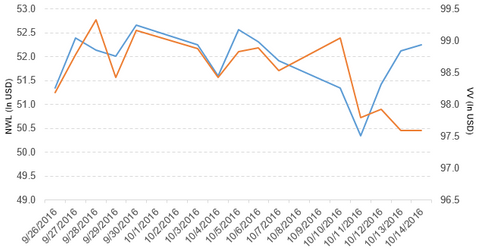
Newell Brands (NWL) rose 0.65% and closed at $52.25 per share during the second week of October 2016. The stock’s weekly, monthly, and YTD (year-to-date) price movements were 0.65%, 2.8%, and 20.0%, respectively, as of October 14. Newell is trading 0.77% above its 20-day moving average, 0.75% below its 50-day moving average, and 13.6% above its 200-day moving average.
Related ETF and peers
The Vanguard Large-Cap ETF (VV) invests 0.12% of its holdings in Newell Brands. VV tracks a market-cap-weighted index that covers 85% of the market capitalization of the US equity market. VV’s YTD price movement was 6.0% on October 14.
The market caps of Newell Brands’ competitors are as follows:
Latest news on Newell Brands
In a press release on October 12, 2016, Newell Brands said, “Newell Brands Inc. (NWL) announced today it has entered into a definitive agreement to sell its Tools business, including the Irwin®, Lenox® and Hilmor® brands, to Stanley Black & Decker. This agreement has been reached in the context of a series of strategic changes announced last week related to the company’s new corporate strategy.”
Performance of Newell Brands in 2Q16
Newell Brands reported 2Q16 net sales of $3.9 billion—a rise of 143.8% compared to net sales of $1.6 billion in 2Q15. The sales from its Writing and Baby and Parenting segments rose 15.8% and 12.4%, respectively. The sales from its Home Solutions, Tools, and Commercial Products segments fell 1.1%, 3.8%, and 7.9%, respectively, between 2Q15 and 2Q16.
Newell Brands reported a loss related to the extinguishment of its debt-credit facility of $1.2 million in 2Q16. The company’s gross profit margin and operating income fell 28.6% and 35.9%, respectively, between 2Q15 and 2Q16.
In 2Q16, Newell Brands’ net income and EPS (earnings per share) fell to $135.2 million and $0.30, respectively—compared to $148.5 million and $0.55, respectively, in 2Q15. It reported non-GAAP[1. generally accepted accounting principles] normalized EPS of $0.78 in 2Q16—a rise of 21.9% compared to 2Q15.
In 2Q16, Newell Brands reported cash and cash equivalents and inventories of $627.3 million and $2.9 billion, respectively—compared to $238.7 million and $935.6 million, respectively, in 2Q15. In 2Q16, its current ratio rose to 1.6x and its long-term debt-to-equity ratio fell to 1.1x—compared to 1.1x and 1.2x, respectively, in 2Q15.
Projections
Newell Brands reaffirmed the following projections for fiscal 2016:
- core sales growth of 3.0%–4.0%
- normalized EPS of $2.75–$2.90
- an effective tax rate of 29%–30%
For an ongoing analysis of this sector, please visit Market Realist’s Consumer Discretionary page.
