A Look at Netflix’s Capital Structure
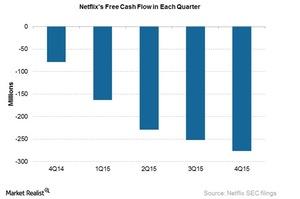
At -$276 million, Netflix had negative free cash flow for the fourth straight quarter in 2015 as the company continued investing in original programming.
Feb. 4 2016, Updated 11:05 a.m. ET

Negative free cash flow
Netflix (NFLX) announced its 4Q15 and 2015 earnings on January 19, 2016.
At -$276 million, Netflix had negative free cash flow for the fourth straight quarter in 2015 as the company continued investing in original programming.
Netflix stated in its earnings letter to shareholders that its investment in original programming requires “more cash upfront relative to licensed content, which will continue to dampen free cash flow.”
The company recorded debt of $2.4 billion and cash and cash equivalents of $2.3 billion on its balance sheet in 4Q15, resulting in net debt of $0.1 billion.
Netflix continues to “burn” cash in 2016
Netflix stated in an interview with Benjamin Swinburne from Morgan Stanley (MS) and Peter Kafka from Re/code on January 19, 2016, that it expects a ratio of cash to profit and loss expense to be in the range of 1.3–1.4 in 2016. Netflix plans “to raise additional debt in late 2016 or early 2017.”
The company stated in its earnings letter to shareholders that despite its free cash flow’s being negative, its bonds have a BB credit rating. A BB credit rating indicates that the bond issued by the company is comparatively less vulnerable to obligation non-payment issues. The company also has a low debt-to-market capitalization ratio, which indicates that it has less debt in comparison to its market value.
Netflix makes up 0.44% of the iShares Russell 1000 Growth Index ETF (IWF). If you’re interested in exposure to the computers sector, IWF has ~6% exposure to that space. IWF also holds 2.4% of Microsoft (MSFT) and 2.3% of Amazon (AMZN).
