How Is Carnival Valued Compared to Its Peers?
Currently, CCL’s forward EV/EBITDA ratio stands at 10.4x. CCL enjoyed its highest valuation of 63x during September 2006. It reached its lows of ~5x in November 2008.
Nov. 20 2020, Updated 2:30 p.m. ET

Forward EV/EBITDA ratio
We covered Carnival’s (CCL) fiscal 4Q15 results expectations earlier in this series. In this part, we’ll discuss the company’s valuation compared to its peers.
Capital-intensive companies like cruise lines are best valued using the EV/EBITDA (enterprise value to earnings before interest, tax, depreciation, and amortization) multiple. These companies have high levels of depreciation and amortization and varying degrees of leverage. The EV/EBITDA is capital structure neutral, thus making these companies comparable.
Current valuation
Currently, CCL’s forward EV/EBITDA ratio stands at 10.4x. This is close to its average valuation (since 2005) of ~10x. This means that analysts are not expecting substantially high earnings growth for CCL in the next four quarters.
CCL enjoyed its highest valuation of 63x during September 2006. It reached its lows of ~5x in November 2008.
Comparison with peers
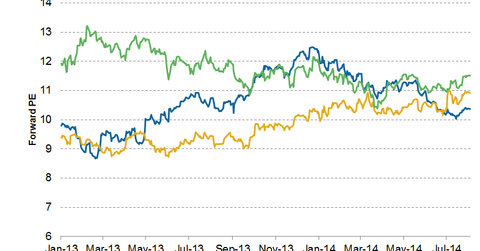
The above chart compares CCL to its peers Royal Caribbean Cruises (RCL) and Norwegian Cruise Line Holdings (NCLH).
- Carnival has the lowest valuation compared to its peers.
- Royal Caribbean Cruises is currently valued at a forward EV/EBITDA multiple of 12x, which is higher than the RCL average valuation of 9.5x.
- Norwegian Cruise Line has a forward EV/EBITDA multiple of ~13x during the same period, which is close to NCL’s average valuation of 12x.
These valuations may mean that analysts are expecting slightly higher growth for RCL and NCL as compared to CCL.
Carnival forms the sixth largest holding of ~5% in the PowerShares Dynamic Leisure and Entertainment Portfolio (PEJ). It also forms 3.9% of the WBI Large Cap Tactical Value Shares (WBIF) and 4.0% of the WBI Large Cap Tactical Select Shares ETF (WBIL).
For more industry updates, please visit Market Realist’s Cruise Lines page.
