Why you should use the Sharpe ratio when investing in the medical device industry
What is a Sharpe ratio? A Sharpe ratio is a tool that measures the amount of returns for each unit of volatility that’s generated by a portfolio (higher returns and lower volatility equals more returns per unit of volatility). The measurement allows investors to analyze how much return they’re receiving from a portfolio in exchange for […]
Nov. 27 2019, Updated 11:36 a.m. ET

What is a Sharpe ratio?
A Sharpe ratio is a tool that measures the amount of returns for each unit of volatility that’s generated by a portfolio (higher returns and lower volatility equals more returns per unit of volatility). The measurement allows investors to analyze how much return they’re receiving from a portfolio in exchange for the level of risk they’re assuming.
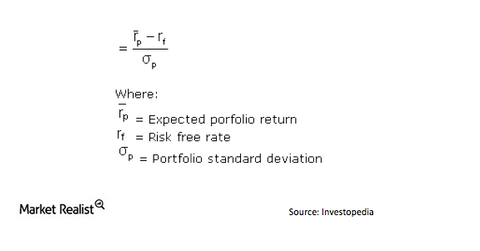
The ratio is calculated accordingly:
The top half of the equation looks at the returns of a fund over a specific amount of time and subtracts the risk-free rate (usually defined as the T-bills rate over that same period). The bottom half is a measure of volatility—or the amount of dispersion among the returns of the portfolio compared to average performance. So the higher the ratio, the more the investor is compensated for the amount of risk taken on.
Why use the Sharpe ratio?
The Sharpe ratio is a way to compare the return of portfolios on a risk-adjusted basis rather than a less informative, pure return basis. From a risk-to-reward perspective, when analyzing an investment, the higher the Sharpe ratio, the more desirable the investment.
You can compare the Sharpe ratios of a particular portfolio to the Sharpe ratios of benchmark or peer group portfolios for a more comprehensive comparative analysis of a fund. Knowing this, we can use the Sharpe ratio to evaluate the risk adjusted-performance of healthcare ETFs relative to other subsector ETFs, benchmark ETFs (like the S&P-SPY), and other industry ETFs.
For example, assume two funds: Fund 1 (SPY) and Fund 2 (XLV). Fund 1 averages a 12% return and fund 2 averages a 10% return. Plus, assume that the standard deviations of funds 1 and 2 are 8% and 5%, respectively. Lastly, we’ll assume a risk-free rate of 5%. At first glance, the return of fund 1 is larger, so it seems to be the better performer. However, the Sharpe ratio for fund 1 is 0.875, while the ratio for fund 2 is 1. So fund 2 is able to generate a higher return on a risk-adjusted basis.
A Sharpe ratio of 1 is considered good, while 2 is considered great and 3 is considered exceptional.
