Comstock Resources Inc
Latest Comstock Resources Inc News and Updates
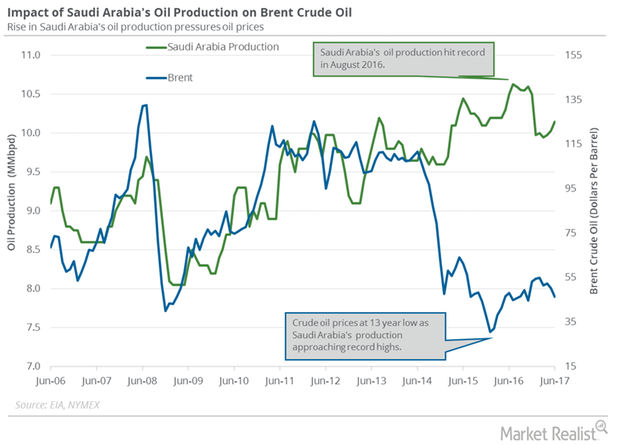
Will Saudi Arabia Remove Excess Oil from the Market?
Saudi Arabia is expected to cut exports 10% to North Asian refiners in September 2017 due to OPEC’s production cut deal.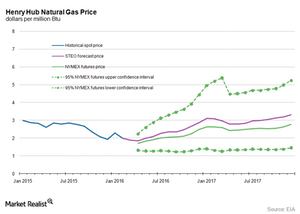
What’s the Long-Term US Natural Gas Price Forecast?
In its March Short-Term Energy Outlook report, the EIA forecast that the US natural gas supply-demand balance could average around 2.9 Bcf per day in 2016.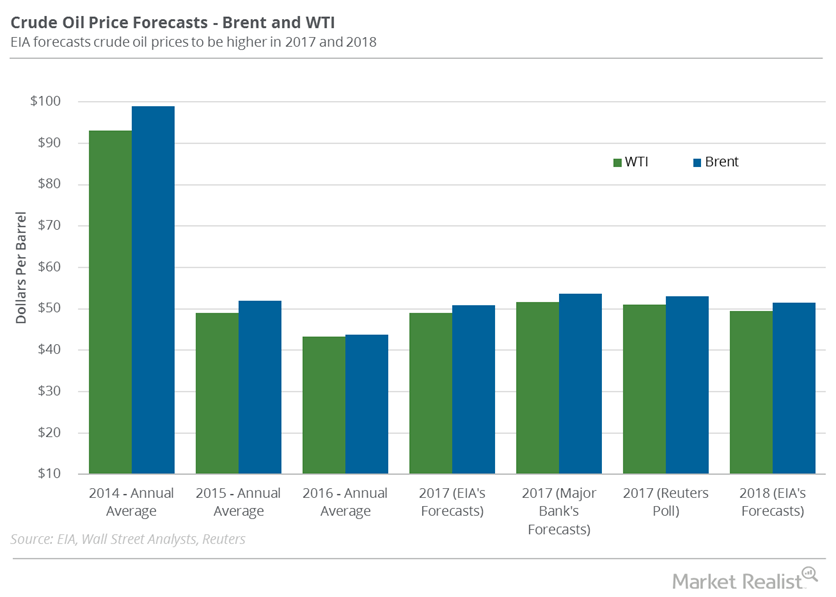
Hedge Funds’ Net Long Positions in US Crude Oil Rose Again
Hedge funds increased their net bullish positions in US crude oil futures and options rose by 36,834 contracts to 215,488 contracts on July 11–18, 2017.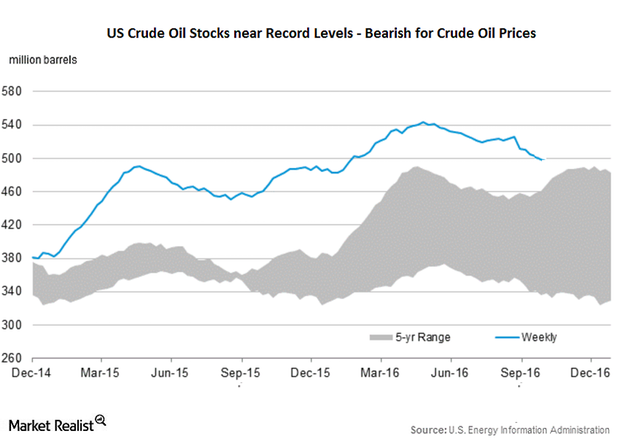
Will API Inventory Report Limit Upside for Crude Oil Prices?
November WTI (West Texas Intermediate) crude oil futures contracts rose 0.32% to $50.97 per barrel in electronic trade at 5:10 AM EST on October 12, 2016.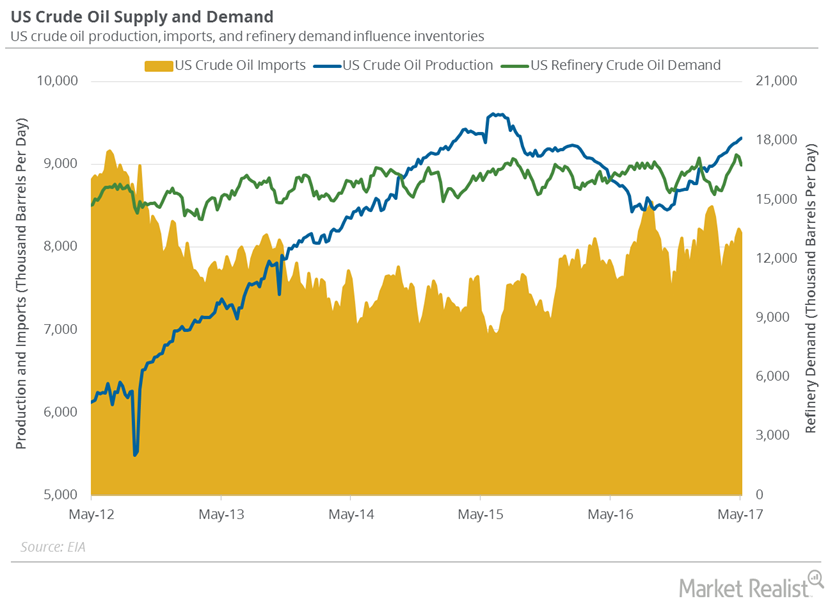
Fall in US Refinery Demand and Imports Impacted Inventories
US refineries operated at 91.5% of their operable capacity in the week ending May 5, 2017. The US refinery demand fell for the second consecutive week.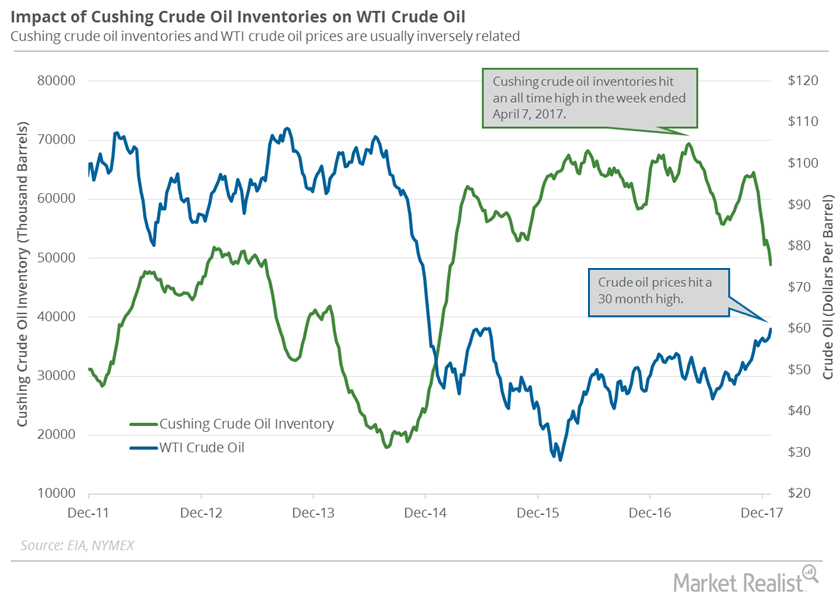
Cushing Inventories Hit February 2015 Low
A Bloomberg survey estimated that the crude oil inventories at Cushing could have fallen by 1.5 MMbbls between December 29, 2017, and January 5, 2018.
What Are the Implied Volatilities of Crude Oil and Natural Gas?
Crude oil’s (USO) (OIIL) implied volatility was 41.3% on July 8, 2016.
Analyzing Hedge Funds’ Net Long Position on US Crude Oil
Hedge funds increased their net long positions in US crude oil futures and options by 16,345 contracts to 149,951 contracts on June 27–July 4, 2017.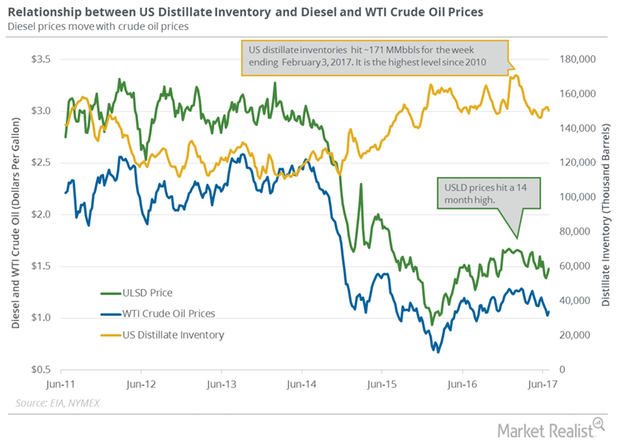
US Distillate Inventories Fell for the Second Straight Week
The EIA reported that US distillate inventories fell by 1.8 MMbbls (million barrels) or 1.2% to 150.4 MMbbls on June 23–30, 2017.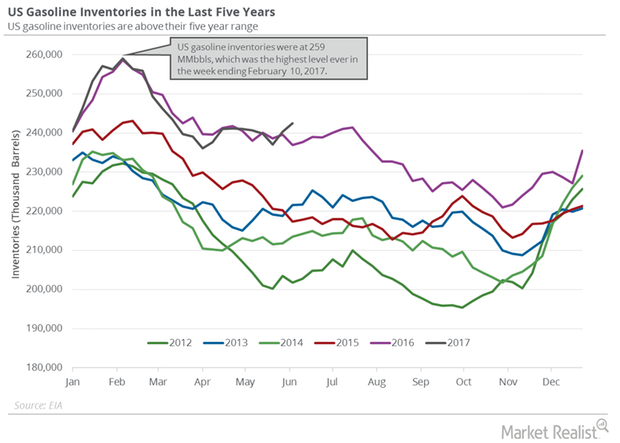
Analyzing US Gasoline Inventories and Gasoline Demand
US gasoline inventories rose by 2.1 MMbbls to 242.3 MMbbls on June 2–9, 2017. Inventories rose 0.9% week-over-week and 2.3% year-over-year.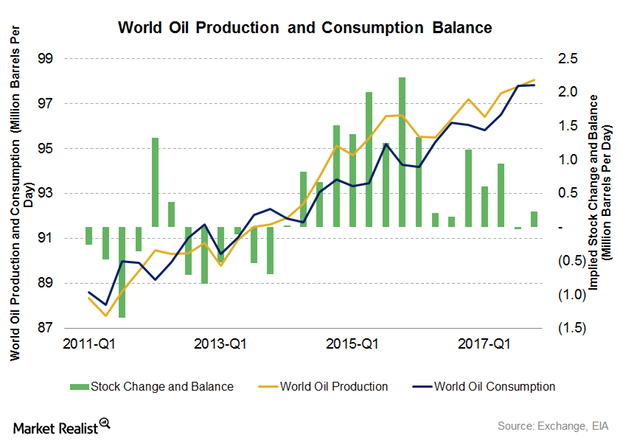
Decoding the World Oil Supply and Demand Gap in 2017
The EIA estimates that the world oil supply and demand gap averaged 780,000 bpd (barrels per day) in 1H16. It’s expected to average 650,000 bpd in 2H16.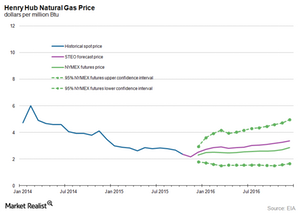
What’s the Long-Term Forecast for Natural Gas Prices?
US natural gas prices have fallen for the third time in the last five trading sessions. Prices are following the long-term bearish trend and trading close to 16-year lows.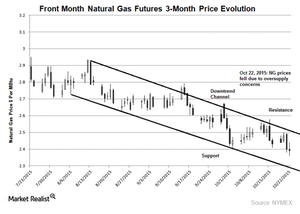
Will Natural Gas Prices Hit New Lows?
Cold winter weather could drive natural gas prices higher. But on the other hand, record natural gas stocks will push natural gas prices lower.
