How to Read Candlestick Patterns Quickly and Correctly
Knowing how to read candlestick patterns correctly can help traders identify profitable trading opportunities.
Sept. 4 2020, Updated 9:11 a.m. ET

A candlestick is a popular tool in technical analysis. For centuries, traders have used candlestick patterns to predict the price direction of assets like stocks and forex. First, Japanese rice traders used candlestick technical analysis to identify profitable trading opportunities. Traders use candlestick patterns with other tools to develop effective trading strategies.
How to read a candlestick chart
Candlestick charts are used to forecast short-term price movements. A candlestick chart allows traders to quickly view a stock’s open, high, low, and close values for a trading period. Every candlestick has three basic features including the body, the shadow or wick, and the color.
The body of a candlestick is usually a rectangular shape that shows the open and close price. The longer the body, the greater the change in price between the open and close. The shadows come out of the top and bottom of the body. If you are looking at a daily candlestick chart, the shadow will display the intraday high and low. The top shadow shows the day’s high, while the bottom shadow shows the day’s low. The length of the shadow also tells a story like whether the price moved up or down during the trading day.
A candlestick will have different colors depending on whether a stock price closed higher or lower from where it started. The candlestick color will be green or white if there was a price increase. The color will be red or black if there was a price decrease.
Many traders like working with candlesticks in technical analysis because they find them more visually appealing than regular bar charts. Also, some traders think that candlestick information is easier to interpret on the fly.
What are candlestick patterns?
Since candlesticks simply display price movements, they often appear random. However, sometimes they form patterns. Traders look at candlestick patterns before making trading decisions.
Candlestick patterns often form from one or more candlesticks. Over the years, traders have been able to take note of regularly appearing candlestick patterns to help them predict what the next price movement might be and how to position themselves to make a profitable trade.
Types of candlestick patterns
There are numerous types of candlestick patterns that can forecast either a reversal in the price trend or the continuation of a trend. If the candlestick pattern indicates a reversal in a trend, it can signal a bullish or bearish turn. There are a few types of candlestick patterns that every trader should know.
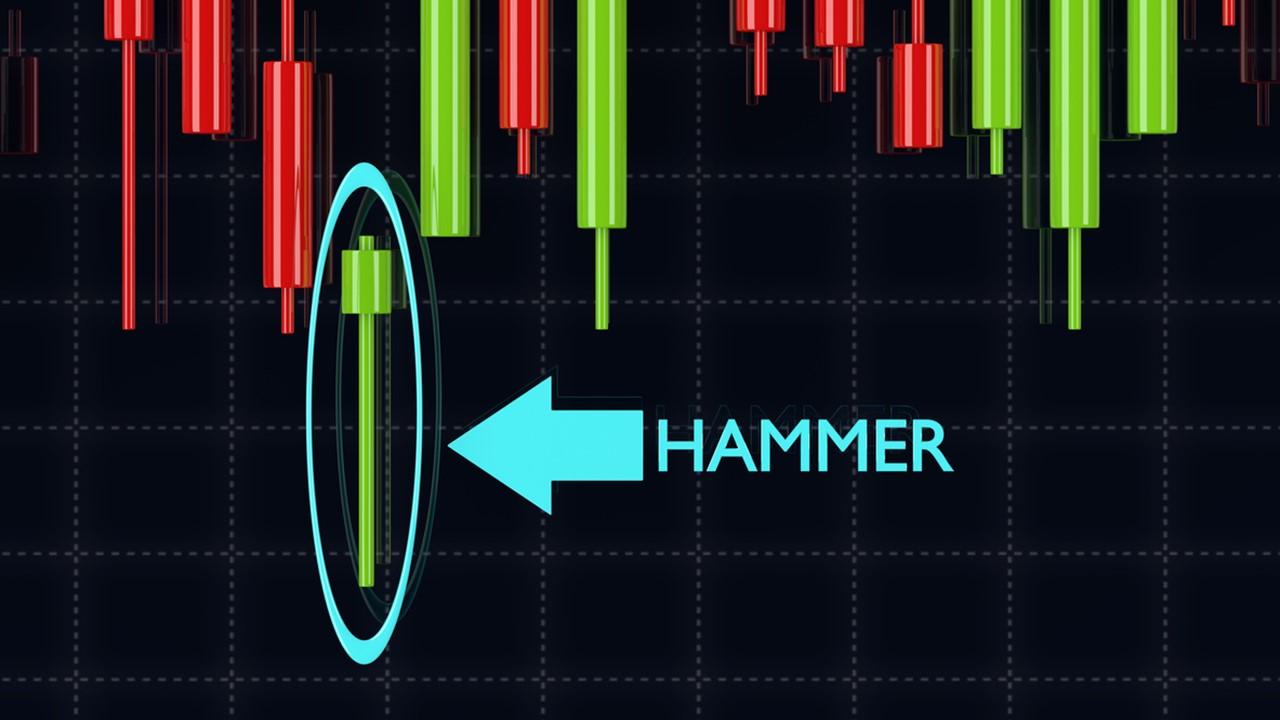
Hammer and Inverted Hammer candlestick patterns
Hammer and Inverted Hammer are both single stick patterns. They are characterized by a short body and long shadow. In the Hammer pattern, the lower shadow is long. In contrast, in the Inverted Hammer pattern, the upper shadow is long. The Hammer and Inverted Hammer patterns signal a bullish reversal of a price movement. The other bullish reversal patterns are Piercing Line, Three White Soldiers, and Morning Star.
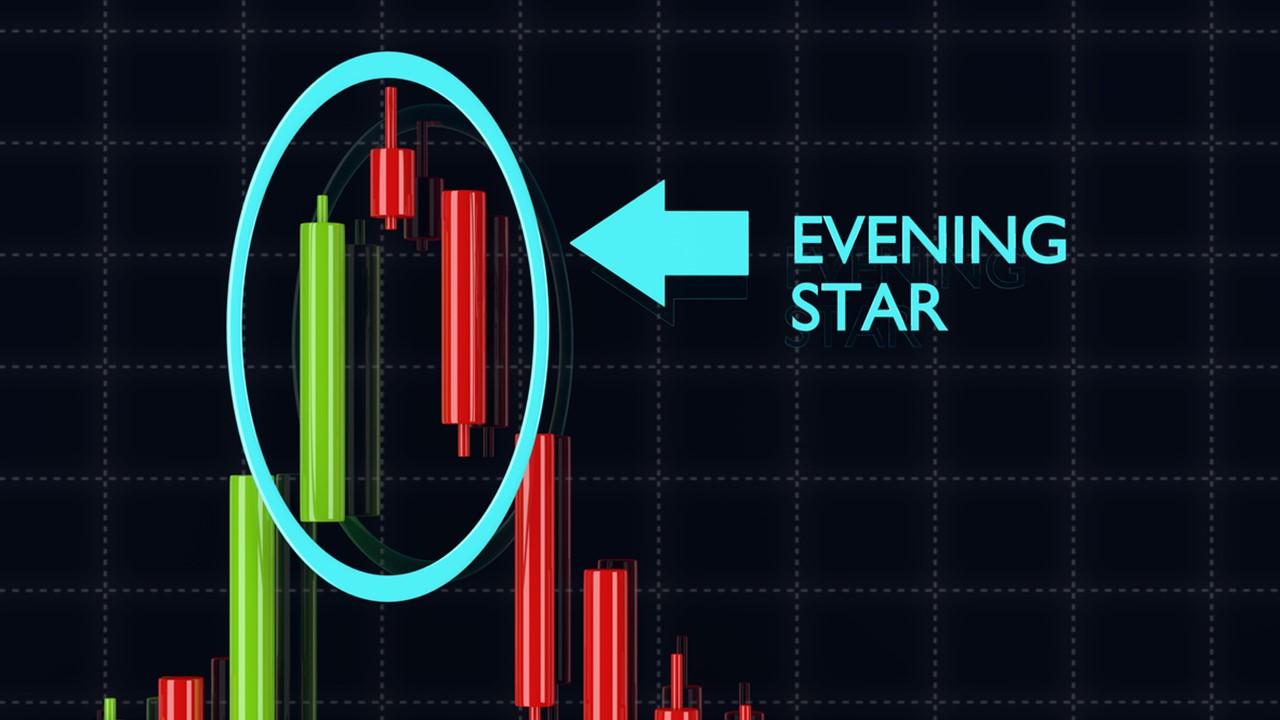
Evening Star candlestick pattern
The Evening Star pattern consists of three candlesticks. A short stick is sandwiched between a long green stick to the left and a long red stick to the right. The short stick sits slightly above the long sticks. The Evening Star pattern may appear at the end of an upward trend and signal a bearish reversal in the price movement. The other candlesticks that signal a bearish reversal include Hanging Man and Three Black Crows.
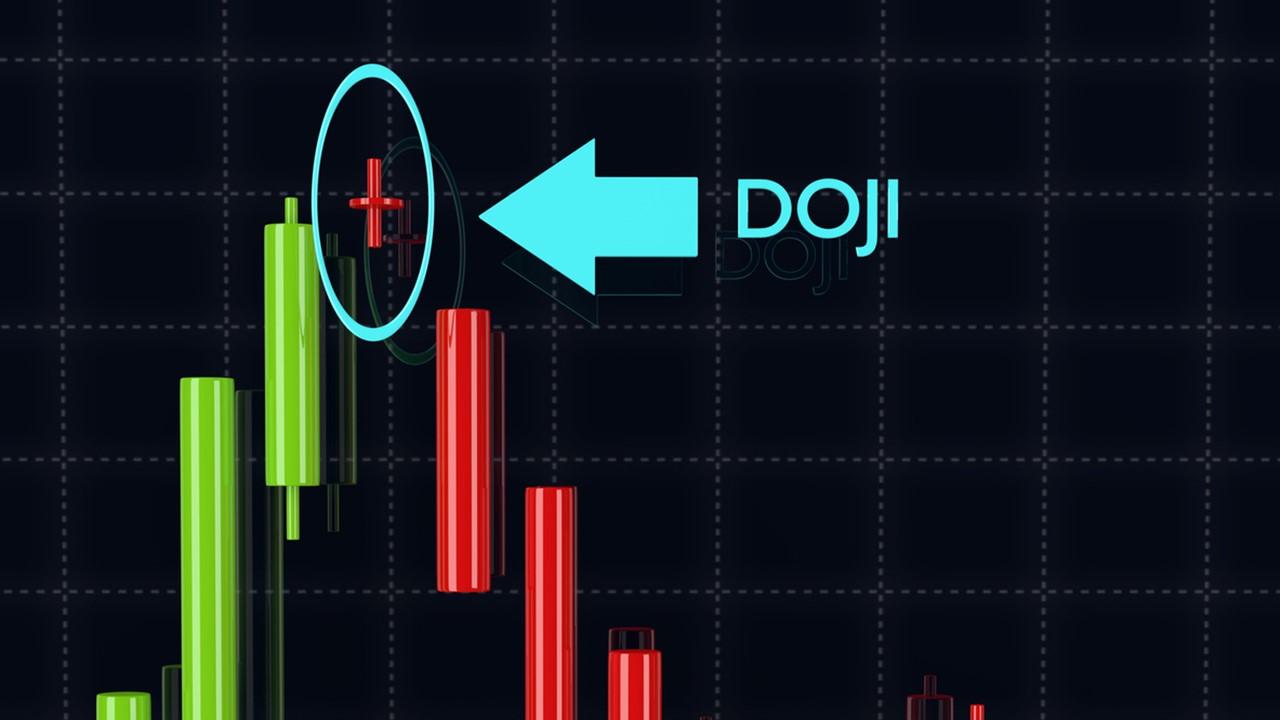
Doji candlestick pattern
The Doji candlestick pattern forms when the open and close prices are almost equal, which results in a candlestick that looks like a cross or a plus sign. The Doji pattern shows a struggle between buyers and sellers to control the market that ends with no significant change in the price. Therefore, the Doji pattern signals the continuation of a trend.
Besides the Doji pattern, the other candlestick patterns that signal a trend continuation include Spinning Top, Rising Three Method, and Falling Three Method.
Are candlestick patterns reliable?
Candlesticks' popularity as a technical analysis tool has led to questions about their reliability. Are candlestick patterns reliable signals to buy or sell securities?
While candlestick patterns can help identify trading opportunities, not all candlesticks are reliable. The reliability can vary based on factors like the timeframe and the security being traded. Due to questions about whether candlestick patterns are reliable, smart investors can use candlesticks alongside other indicators to improve their technical analysis.