How Do You Use Chaikin Analytics? A Look at the Stock Market Research Tool
If you’re looking for the best stock market research tool, you may be wondering how Chaikin Analytics works and whether it’s right for you.
March 17 2022, Published 5:44 a.m. ET

Chaikin Analytics, a stock research tool built by Wall Street veteran Marc Chaikin, offers retail investors professional-grade stock-picking insights. The tool requires a paid subscription to access. How does Chaikin Analytics work? It is worth the cost?
You, like everyone, are in the stock market to make money. As a result, competition to find the next big opportunity is stiff. There are plenty of stocks to pick from across a diverse range of industries, but not all can deliver returns. To identify the best stocks to buy, investors leverage a variety of tools, including Chaikin Analytics.
How does Chaikin Analytics work?
Chaikin Analytics is designed to help investors pick the best stocks and ETFs for their portfolio, with the goal of maximizing returns. It does this through a research and rating system complemented by expert insights. The rating system offers a report-card-type measurement of stocks’ potential.
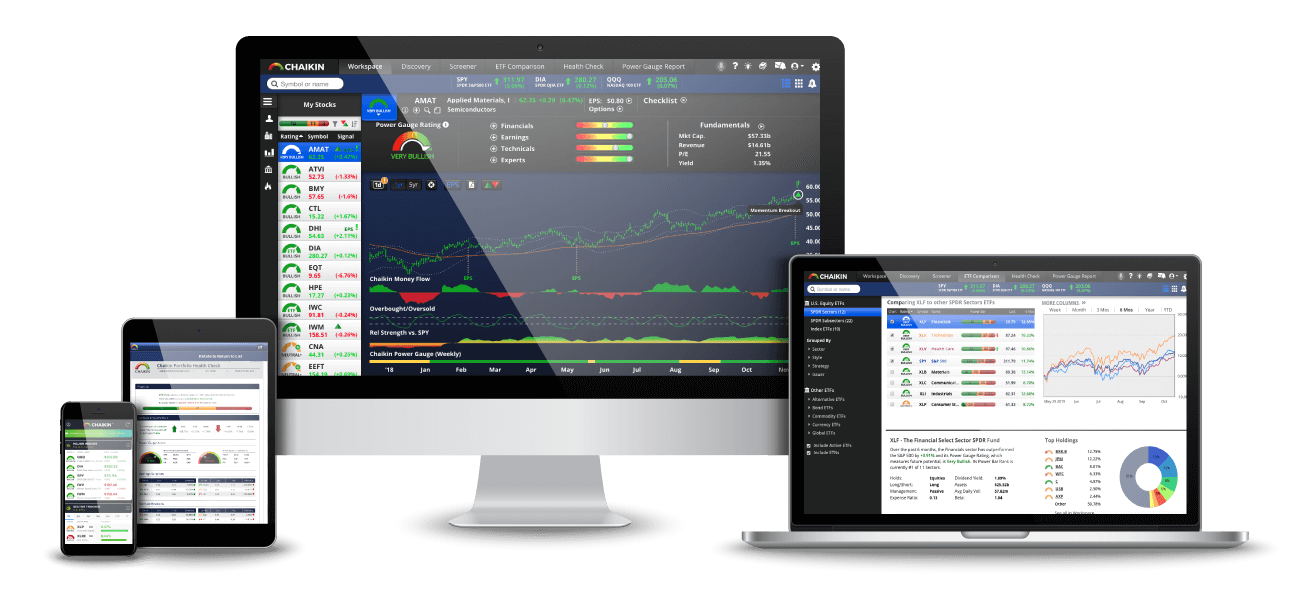
The ratings range on a color scale, where red represents bearish, yellow represents neutral, and green represents bullish. To rate stocks, the tool considers 20 potential factors in price movements.
If a stock is marked red (bearish), the stock is likely to underperform the market and investors may want to dump or short it. On the other hand, green (bullish) denotes stocks likely to outperform the market, and investors may want to buy them. The ratings suggest how stocks are likely to behave over the next one to six months.
The Chaikin Analytics model is based on the Russell 3000, an index representing more than 98 percent of the U.S. stock market cap. However, the tool analyzes and rates a total of 5,000 stocks.
Who is Marc Chaikin?
During his time on Wall Street, Marc Chaikin built tools that helped portfolio managers make smart investment decisions. Driven by the belief that earnings drive stock prices and that things go bad for overvalued stocks and well for cheap stocks, Chaikin offered valuable trading strategies that many professional investors came to rely on.
Somewhere down the road, Chaikin realized he wanted to help small investors succeed on Wall Street as well. That realization led to Chaikin Analytics, previously called Chaikin Stock Research.
Is Chaikin Analytics worth it?
Chaikin Analytics' annual membership, which costs about $3,200, gives you access to research, ratings, exclusive content, and videos on more than 5,000 stocks and ETFs to help you make smart investment decisions. There are products that investors can purchase separately from the annual membership plan as well, such as the Power Pulse Premium service or monthly Power Gauge Report. Each costs about $120 per year.