DXC Stock Is Trading at a Deep Discount to Analysts’ Price Target
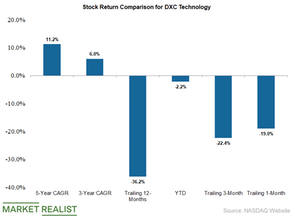
DXC (DXC) stock has fallen 36.2% in the last 12 months, 19% in the last month, and 22.4% in the last three months.
May 24 2019, Published 12:50 p.m. ET

Stock returns for DXC
DXC (DXC) stock has fallen 36.2% in the last 12 months, 19% in the last month, and 22.4% in the last three months. DXC stock has generated annual returns of 11.2% in the last five years and 5.9% in the last three years. Since the start of fiscal 2019, DXC stock has fallen 2.2%.
Analysts’ recommendations
Of the 19 analysts tracking DXC stock, 12 have recommended “buys,” seven have recommended “holds,” and none have recommended “sells” on the stock.
Analysts’ 12-month average price target for DXC is $86.69, and their median estimate is $87.0. DXC stock is trading at a significant discount of 67.0% to analysts’ median estimate.
Moving averages
On May 23, DXC closed the trading day at $51.98. Based on that price, the stock was trading as follows:
- 17.7% below its 100-day moving average of $63.16
- 17.3% below its 50-day moving average of $62.88
- 12.8% below its 20-day moving average of $59.61
MACD and RSI
DXC’s 14-day MACD (moving average convergence divergence) is -3.49. A stock’s MACD marks the difference between its short-term and long-term moving averages. DXC’s negative MACD score indicates a downward trading trend.
DXC has a 14-day RSI (relative strength index) score of 21, which shows that the stock is trading well into oversold territory. An RSI score of above 70 indicates that a stock has been overbought, while an RSI score of below 30 indicates that a stock has been oversold.
