Why Is Halliburton’s Valuation Attractive?
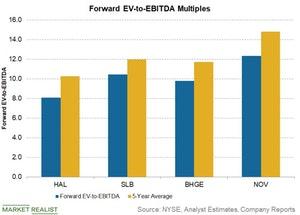
Halliburton (HAL) is trading at a forward EV-to-EBITDA multiple of ~8.1x, which is lower than its five-year average multiple of 10.2x.
March 25 2019, Published 11:15 a.m. ET

Forward EV-to-EBITDA multiple
Halliburton (HAL) is trading at a forward EV-to-EBITDA multiple of ~8.1x, which is lower than its five-year average multiple of 10.2x. Halliburton’s forward EV-to-EBITDA multiple is also lower than peers’ multiples. Schlumberger (SLB) is trading at a forward EV-to-EBITDA multiple of ~10.5x. Baker Hughes (BHGE) is trading at a multiple of 9.8x, while National Oilwell Varco (NOV) is trading at 12.3x.
The above graph compares Halliburton, Schlumberger, Baker Hughes, and National Oilwell Varco’s forward EV-to-EBITDA multiples. As the graph shows, all four of the stocks are trading at multiples lower than their respective five-year average multiples.
Based solely on the forward EV-to-EBITDA multiple, Halliburton looks undervalued. National Oilwell Varco is the most expensive among the four peers.
The EV-to-EBITDA multiple is neutral to capital structure. The multiple considers the company’s debt and equity. A lower ratio indicates possible undervaluation.
Forward PE ratio
Halliburton’s forward PE ratio of ~18x is lower than Schlumberger and Baker Hughes’s ratios. Schlumberger is trading at a forward PE ratio of 25x, while Baker Hughes is trading at 24x.
Expected softness in North America completions activity has impacted Halliburton stock. The company expects the softness to continue in the first half of 2019. The softness impacted the stock’s recent performance and contributed to its discounted valuation.
